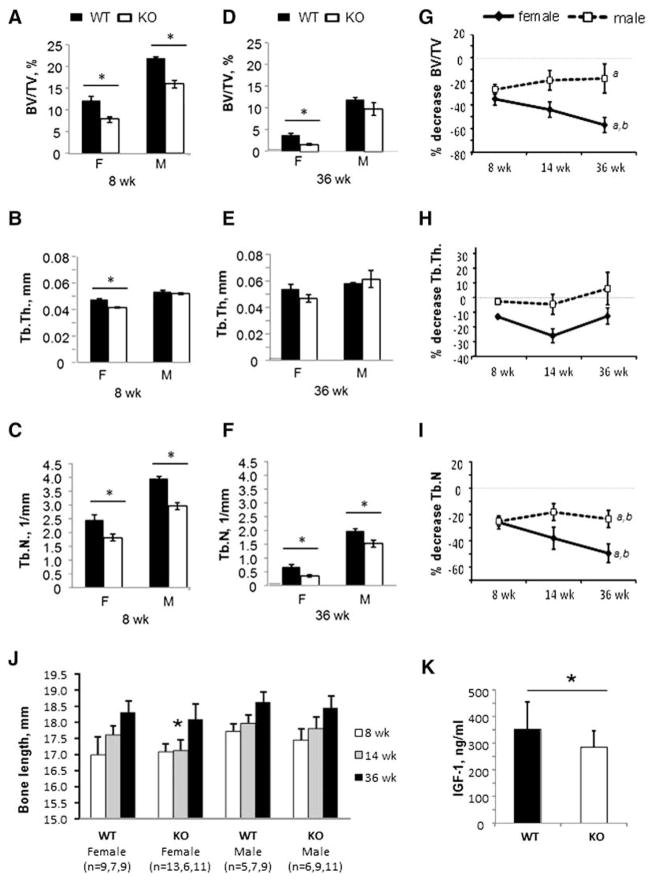
Fig. 6.
Longitudinal effects of Kalirin deletion on bone mass. (A–C) Trabecular bone analysis of 8 week-old female Kal-KO and WT mice (n = 5,5) and male Kal-KO and WT mice (n = 3,11). BV/TV, Tb.Th and Tb.N were determined by micro-CT. Statistically significance (p < 0.05) compared to sex-matched WT mice is indicated by an asterisk. (D–F) Trabecular bone analysis of 36 week-old female Kal-KO and WT mice (n = 7,8) and male Kal-KO and WT mice (n = 8,6). The asterisk indicates statistically significance (p < 0.05) compared to sex-matched WT mice. (G–I) The difference in BV/TV between age- and sex-matched Kal-KO and WT mice was determined and expressed as a percentage relative to WT mice. The numbers of 8 and 36 week-old mice was the same as above. For 14 week-old mice we used female WT and Kal-KO mice (n = 7,6) and male WT and Kal-KO mice (n = 6,5). Statistical significance was determined using 2-way Anova and “a” indicates p < 0.05 for the comparison 36 versus 8 week-old mice, “b” indicates p < 0.05 for 36 versus 14 week-old mice. (J). Digital calipers were used to measure the length of femoral bones from WT and Kal-KO mice (mm). (K). Serum levels of IGF-1 in 14 week-old female WT (n = 13) and Kal-KO (n = 21) mice (see Supplementary figure for additional data). All results shown are mean ± SEM.

