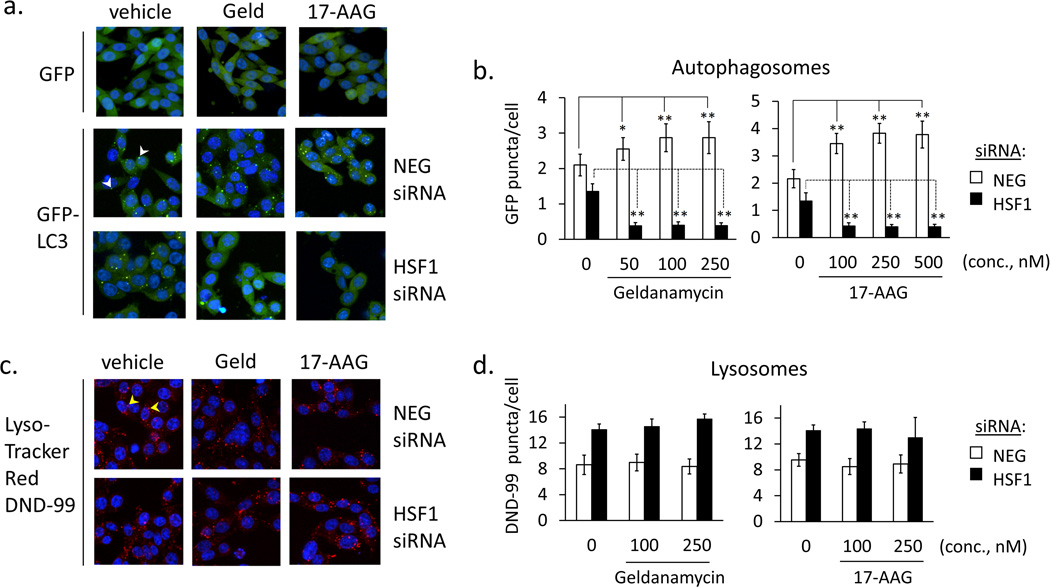
Fig. 6.
Autophagosome and lysosome levels in control and Hsp90 inhibitor-treated cells. a. Stable clones of RKO expressing GFP (negative control) or GFP-LC3 (NEG-siRNA or HSF1siRNA transfected) were treated with geldanamycin or 17-AAG (250 nM) for 8 h. Fluorescent images of Hoescht 33342-stained cells were collected by high content screening. Representative images were re-constructed from 3 confocal planes using PE Volocity software. b. Green fluorescent puncta (autophagosomes, white arrowheads) were counted for 4,000 nuclei using PE Columbus software. Bar graphs represent mean values and error bars represent standard deviations (*p<0.005; **p<0.001 vs. DMSO control sample data) c. siRNA-transfected RKO cells were treated with geldanamycin or 17-AAG (250 nM) for 4 h and stained with LysoTracker Red DND-99 and Hoescht 33342. d. Red fluorescent puncta (lysosomes, yellow arrowheads) were counted for 4,000 nuclei using PE Columbus software. Bar graphs represent mean values and error bars represent standard deviations, showing no statistically significant (p<0.05) differences between vehicle (DMSO)-treated and inhibitor-treated samples.

