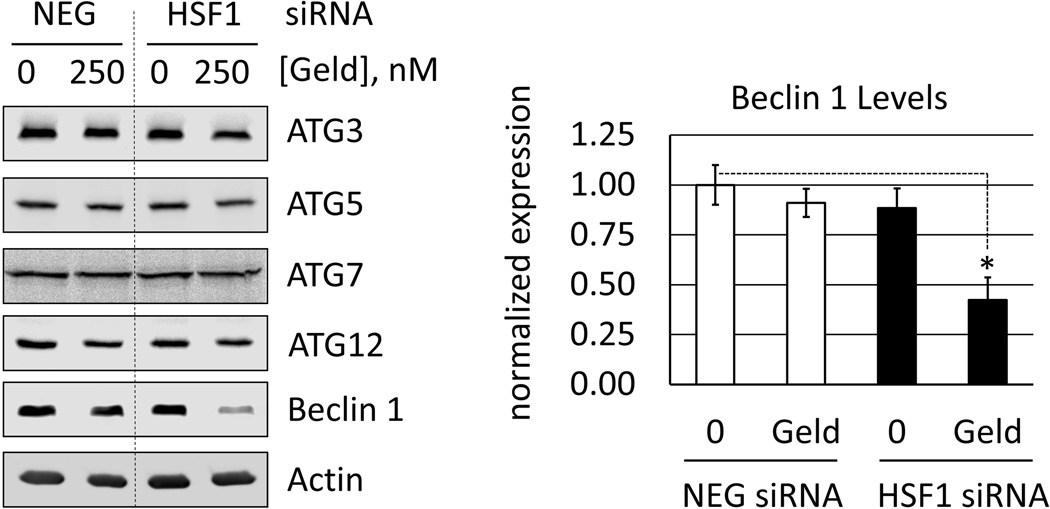
Fig. 8.
Expression of autophagy-related (ATG) proteins and Beclin 1 in control and HSF1silenced cells. RKO were transfected with negative control (NEG) or HSF1 siRNA (HSF1) and treated with vehicle (0.1% DMSO) or geldanamycin (250 nM) for 6 h. a. Total proteins were analyzed by Western blot. Images are representative from n = 3. b. Analysis of Beclin 1 expression level by Li-Cor Odyssey, normalized to actin (loading control) and displayed relative to NEG siRNA-transfected, DMSO-treated (control) cells. Bar graph represents mean normalized values and error bars represent standard deviations (* = p<0.001).

