
Figure 8.
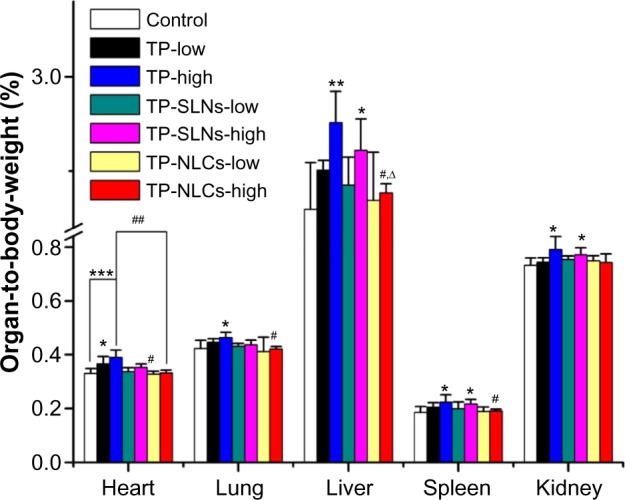
Relative organ weights to body weight of male rats administered with low and high dose of TP, TP-SLNs, and TP-NLCs by gavage after a 4-week treatment period.
Notes: Each value represents the mean ± SD (n=6); *P<0.05; **P<0.01; ***P<0.001 compared to control group; #P<0.05; ##P<0.01 compared to TP group at the same level (low or high); ∆P<0.05, compared to TP-SLNs group at the same level (low or high).
Abbreviations: SD, standard deviation; TP, triptolide; TP-NLCs, triptolide-loaded nanostructured lipid carriers; TP-SLNs, triptolide-loaded solid lipid nanoparticles.