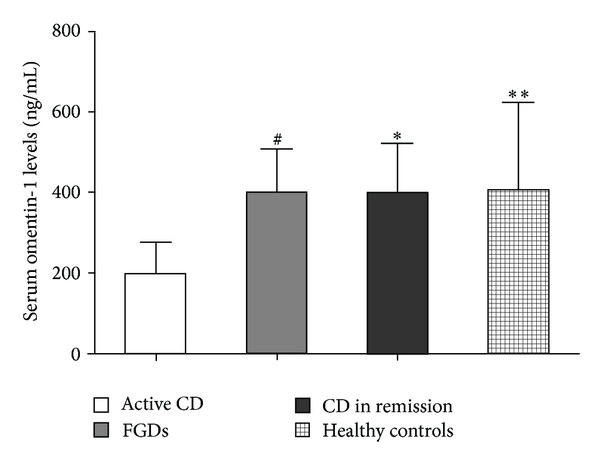
Figure 1.

Serum omentin-1 concentrations in the healthy controls (HC, n = 60), functional gastrointestinal disorders (FGDs, n = 120), active Crohn's disease (CD, n = 112), and CD in remission (n = 128). # P < 0.01 versus active CD, *P < 0.01 versus active CD, **P < 0.01 versus active CD.
