Figure 7.
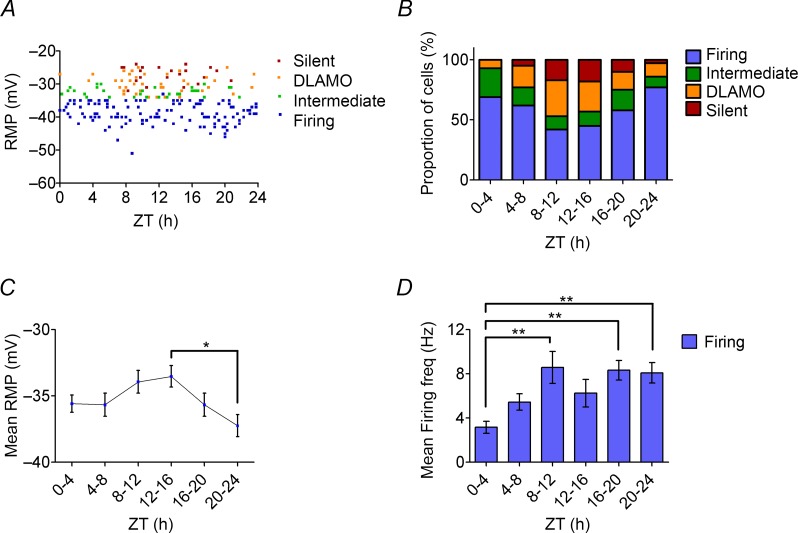
A, scatter plot showing the RMP of the different spontaneous states of MHb neurones versus ZT time, with each data point representing an individual cell. B, the proportions of the cells in the different spontaneous states in each 4 h time bin are shown as percentages; these varied significantly across the 4 h time bins (P < 0.05; χ2 test). C, the mean RMP values in 4 h time bins of the MHb neurones varied across the projected day–night cycle and were significantly higher during the early night (ZT 12–16; −33.5 ± 0.8 mV), but were at their lowest at late night (ZT 20–24; −37.3 ± 0.8 mV). D, the mean firing rate in 4 h time bins of the MHb neurones showed significant variation in the firing rate across the projected day–night cycle (one-way ANOVA, P < 0.001), with maximal firing rates occurring at late day (ZT 8–12; 8.6 ± 1.9 Hz) and later in the night ZT 16–20; 8.3 ± 0.9 Hz), while minimal firing rates occurred in the early day (ZT 0–4; 3.2 ± 0.5 Hz). Tukey's post hoc test; *P < 0.05, **P < 0.01.

