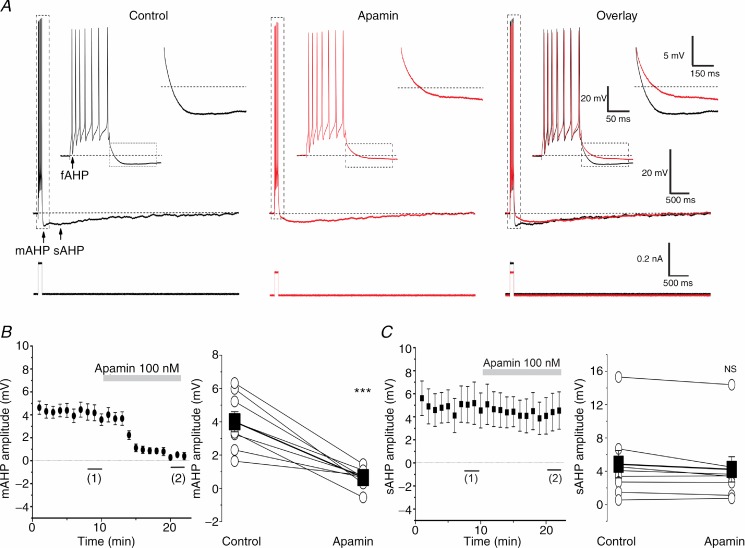
Figure 1.
A, typical examples of whole-cell current clamp recordings from a DGC showing repetitive spiking in response to a depolarizing current pulse (100 ms long) before (black) and after (red) bath application of 100 nm apamin. The APs are followed by fAHP, mAHP and sAHP. The background membrane potential prior to stimulation was kept at –62 mV (dashed line) by depolarizing holding current injection, and the current pulse amplitude was adjusted to produce a train of seven APs. The insets show expanded traces from the marked periods (dashed rectangles). Note that apamin suppressed the mAHP, but had essentially no effect on the sAHP. B, left, time course of the effect of apamin on the mAHP peak amplitude (n = 8). The summary graph (right) shows the effect of apamin (n = 8, P < 0.001 (***)) on the mAHP in all cells tested (○) and the mean value (▪). C shows that apamin had no significant effect on the sAHP peak amplitude (n = 8, P > 0.05 (NS)). For the analysis, the mean AHP amplitudes during the last 3 min (1) before apamin application were compared to the last 3 min after full effect of apamin (2).

