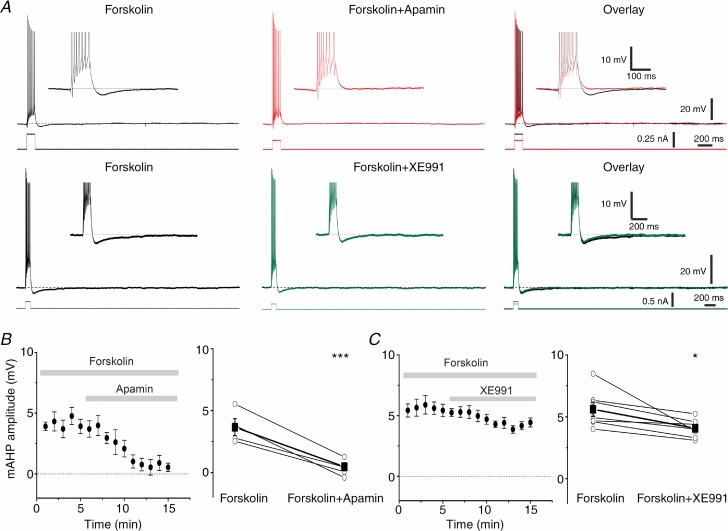
Figure 4.
A, typical traces showing the effect of apamin (100 nm, top traces) on the isolated mAHP after sAHP suppression by forskolin (50 μm); bottom traces show representative examples of the effect of XE991 (10 μm) on the isolated mAHP. B, averaged time plot (n = 5, left panel) showing the effect of apamin on the time course of the isolated mAHP. Summary plot (right panel) showing the individual and mean values before and after application of apamin (n = 5, P < 0.001 (***)). C, similar plots summarizing the effect of XE991 on the isolated mAHP (n = 7, P < 0.05 (*)). Note the smaller mAHP reduction after Kv7/M channel blockade compared to SK channel blockade.

