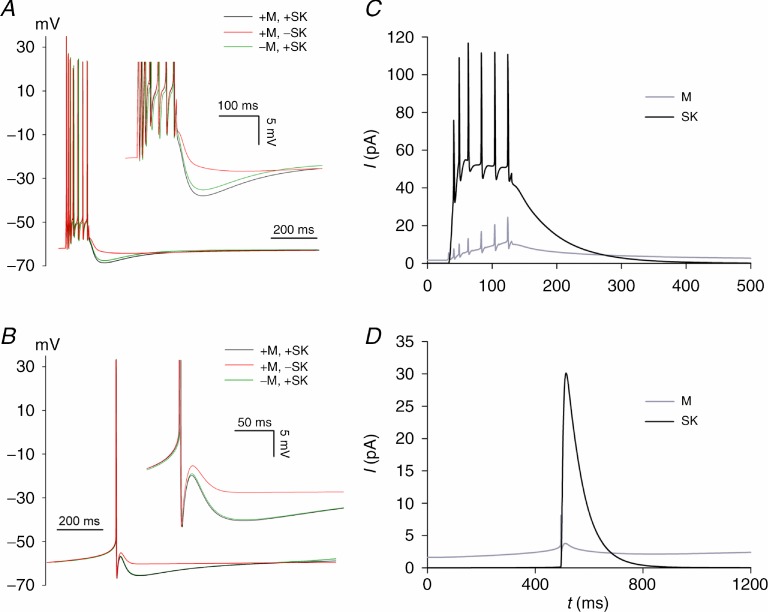
Figure 6.
A and B show plots of V(t) with ‘+’ and ‘−’ indicating ‘presence’ and ‘absence’ of the M-and SK-conductances. These plots should be compared with the experimental data in Figs 4 and 5. C and D show plots of the currents ISK(t) and IM(t) (both integrated over the model neuron) for the +M, +SK regime.

