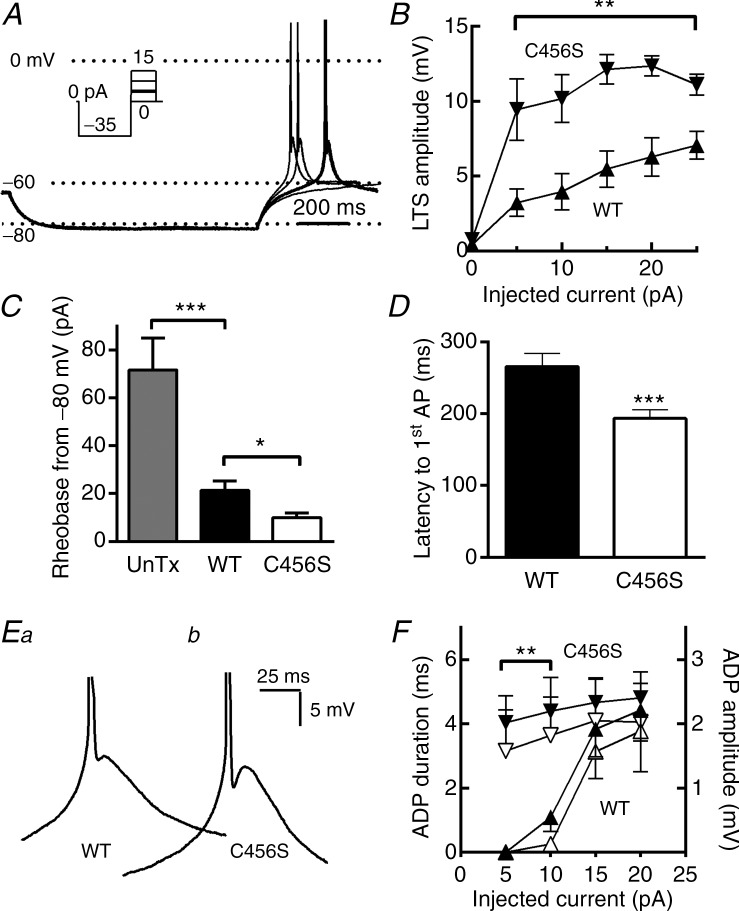
Figure 2.
A, representative current-clamp traces from four consecutive sweeps. This cell was at the typical resting membrane potential of −60 mV (Vm). Injection of –35 pA current hyperpolarized the membrane to −82 mV. After this hyperpolarizing current injection, the neuron was allowed to return to the resting membrane potential or injected with small depolarizing current pulses. In this example, injection of 5 pA current triggered a low-threshold spike that was crowned with an AP (bold trace). B, the amplitude of the low-threshold depolarization was estimated from the peak of the after-depolarization to the baseline Vm, and plotted as a function of the depolarizing current amplitude. C, quantification of the amount of depolarizing current (pA) required to trigger an AP (rheobase) when cells were hyperpolarized to −80 ± 1 mV. D, average latency from the end of the hyperpolarizing pulse to the AP. E, representative low-threshold spikes from neurons transfected with either wild-type (WT) (Ea) or C456S (Eb) are shown at an expanded scale to highlight the after-depolarizing potential (ADP). F, quantification and statistical analysis of the ADP. ADP durations and amplitudes were estimated from the trough after the AP to the ADP peak. Average ADP durations are shown in solid triangles and amplitudes in open triangles. In all figures WT data are represented with upward triangles (▴) and C456S with downward triangles (△). Student's t test was used for statistical analysis (B, F); the Mann–Whitney test was used for analysis of other data (C, D). *P < 0.05; **P < 0.01; ***P < 0.001. Data were recorded from: (1) untransfected neurons (n = 12); (2) neurons transfected with a plasmid encoding WT Cav3.2 channels (n = 19), or (3) neurons transfected with a plasmid encoding the childhood absence epilepsy variant of Cav3.2, C456S (n = 17).

