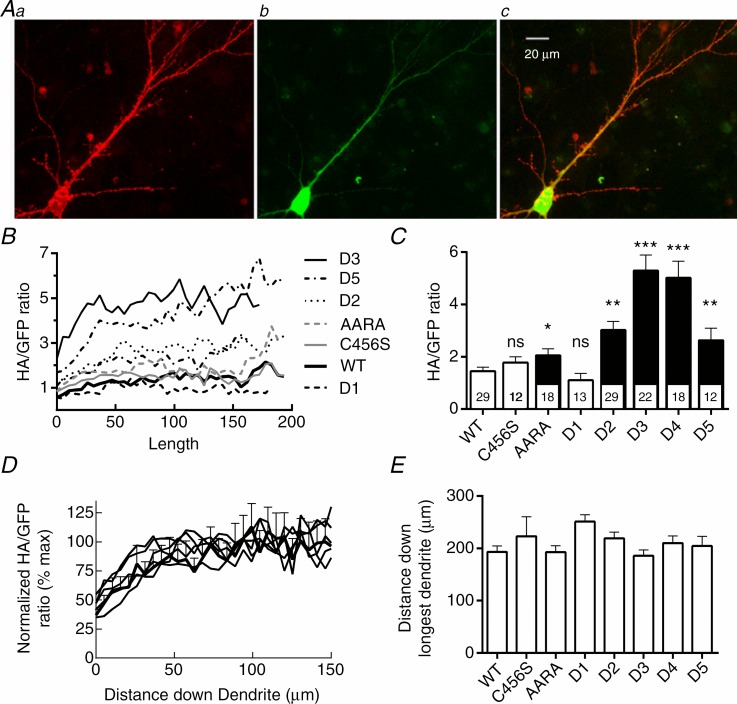
Figure 4.
A, images of a single neuron transfected with the plasmid Syn-mGFP-2A-Cav3.2-D4. Aa, surface channels were labelled with a mouse anti-HA monoclonal primary antibody and a goat anti-mouse Alexa Fluor 568 secondary antibody. Ab, green fluorescent protein (GFP) fluorescence was imaged without immunofluorescent amplification. Ac, merge of the two previous images. B–D, analysis of channel and GFP trafficking from the soma down the length of the longest dendrite. All images of a particular fluorophore were acquired with exposures of the same duration to allow for comparison. B, the ratio of the HA-tagged channel signal to the GFP signal is plotted as a function of distance away from the cell body. The ratio for each cell was calculated, then averaged. Error bars are not shown for clarity. C, the maximal HA : GFP ratio was calculated as the average signal observed between 100 μm and 150 μm from the cell body, where the signal plateaus (see D). ANOVA was used for statistical analysis; numbers of cells studied are shown inside the respective column in C. Significant differences from wild-type (WT) Cav3.2 channels are indicated as follows: *P < 0.05; **P < 0.01, and ***P < 0.001. D, the data in panel B were normalized to the maximum ratio observed (indicated as %) and plotted as a function of distance down the dendrite. Error bars are shown for WT channels to emphasize that there were no statistical differences between the curves. E, the distance from the soma that the channel trafficked down the longest dendrite. Measurement ended when the HA-signal was <2 standard deviations above the background signal. There was no statistical difference between the channel variants.

