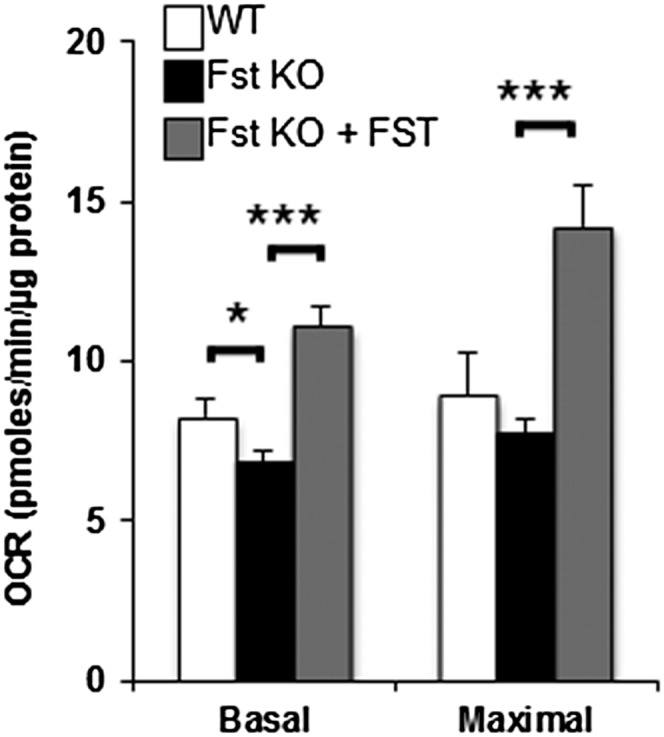
Fig. 5.

Measurements of OCR in differentiated WT and Fst KO MEFs. Eight day-differentiated MEFs were activated with 10 nM CL 316,243 for 2 h prior to OCR measurements. Basal respiration and maximal respiration capacity were obtained before and after FCCP injection, respectively (n = 3). Data are expressed as mean ± SEM. *P ≤ 0.05; ***P ≤ 0.001.
