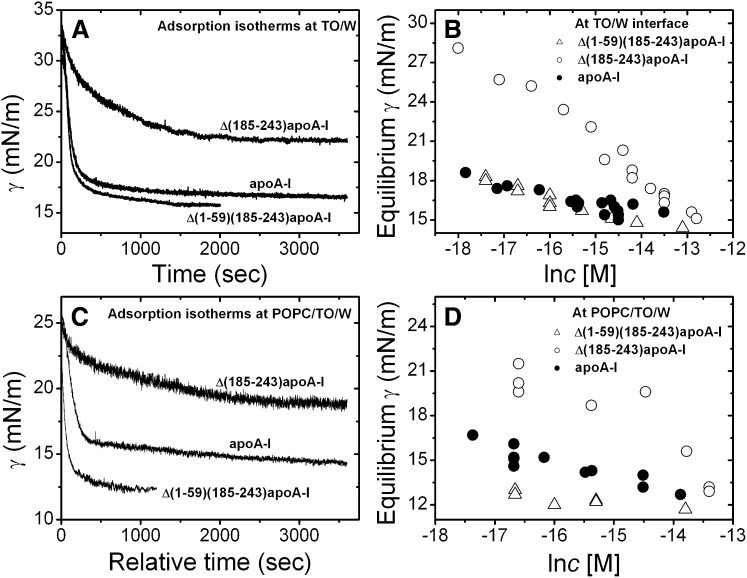
Fig. 1.
A: Examples of the adsorption isotherms at the TO/W interface. Δ(1-59)(185-243)apoA-I (2.3 × 10⁻⁷ M), Δ(185-243)apoA-I (3.1 × 10⁻⁷ M), and apoA-I (3.3 × 10⁻⁷ M) in the aqueous phase (2 mM, pH 7.4, phosphate buffer). B: The equilibrium γ against natural log of the protein concentration plots at the TO/W interface. Open triangle, Δ(1-59)(185-243)apoA-I; open circle, Δ(185-243)apoA-I; solid circle, apoA-I. C: Examples of the adsorption isotherms at the POPC/TO/W interface. Δ(1-59)(185-243)apoA-I (2.3 × 10⁻⁷ M), Δ(185-243)apoA-I (2.1 × 10⁻⁷ M), and apoA-I (1.7 × 10⁻⁷ M) in the aqueous phase (2 mM, pH 7.4, phosphate buffer). D: The equilibrium γ against natural log of the protein concentration plots at the POPC/TO/W interface. Open triangle, Δ(1-59)(185-243)apoA-I; open circle, Δ(185-243)apoA-I; solid circle, apoA-I.

