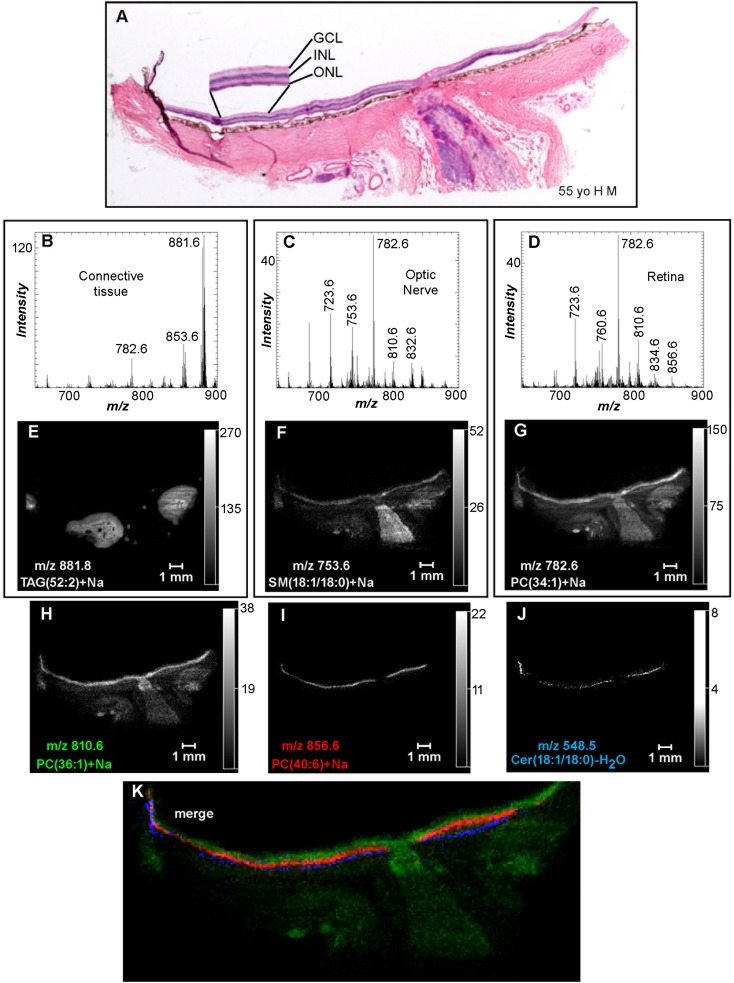
Fig. 2.
Positive ion MALDI IMS of PC and SM lipids in human ocular tissue. A: H&E stain of ocular tissue section immediately adjacent to the section used for MALDI imaging. Total positive ion MALDI mass spectra of the accessory tissue (B), optic nerve (C), and retina (D) were obtained directly from the ocular section. Extracted positive ion MALDI images of the [M+Na]+ of TAG(52:2) (m/z 881.8) (E), SM(d18:1/18:0) (m/z 753.6) (F), PC(34:1) (m/z 782.6) (G), PC(36:1) (m/z 810.6) (H), PC(40:6) (m/z 856.6) (I), and the [M+H-H2O]+ of Cer(d18:1/18:0) (m/z 548.5) (J). K: Merged positive ion MALDI image of Cer(d18:1/18:0) (blue), PC(40:6) (red), and PC(36:1) (green). GCL, ganglion cell layer.

