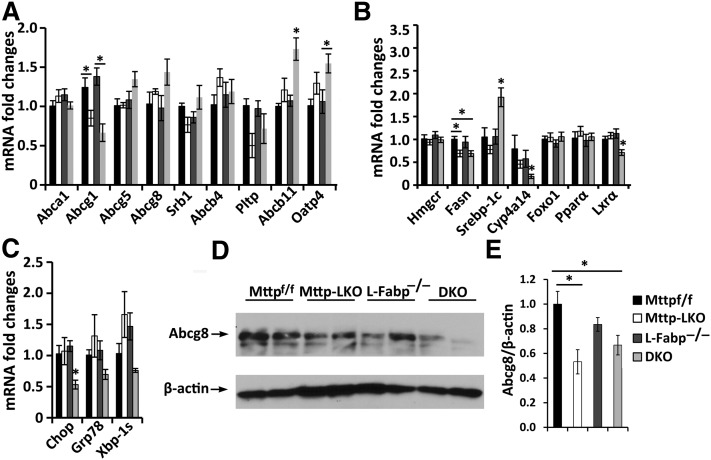
Fig. 3.
A, B: mRNA expression of genes related to cholesterol, phospholipid, and bile acid metabolism and transport. Hepatic mRNA was extracted from mice fed a LD for 2 weeks. mRNA expression of indicated gene was quantitated by real-time qPCR and the value expressed as fold change relative to Mttpf/f mice, which was defined as 1. C: mRNA expression of genes related to ER stress. The bars represent the mean ± SE (n = 4–8 per group). D, E: Protein expression of cholesterol transporter Abcg8. Membrane protein (50 μg) from the indicated genotypes of mice was separated by 8% SDS-PAGE. Abcg8 expression was determined by Western blot and quantitated by Kodak Image software, with β-actin as loading control. D: The representative image. E: The bar graph of relative Abcg8 abundance (mean ± SE of 4 mice per group) after normalizing expression to Mttpf/f mice (n = 4 per group). *P < 0.05.

