Fig. 3.
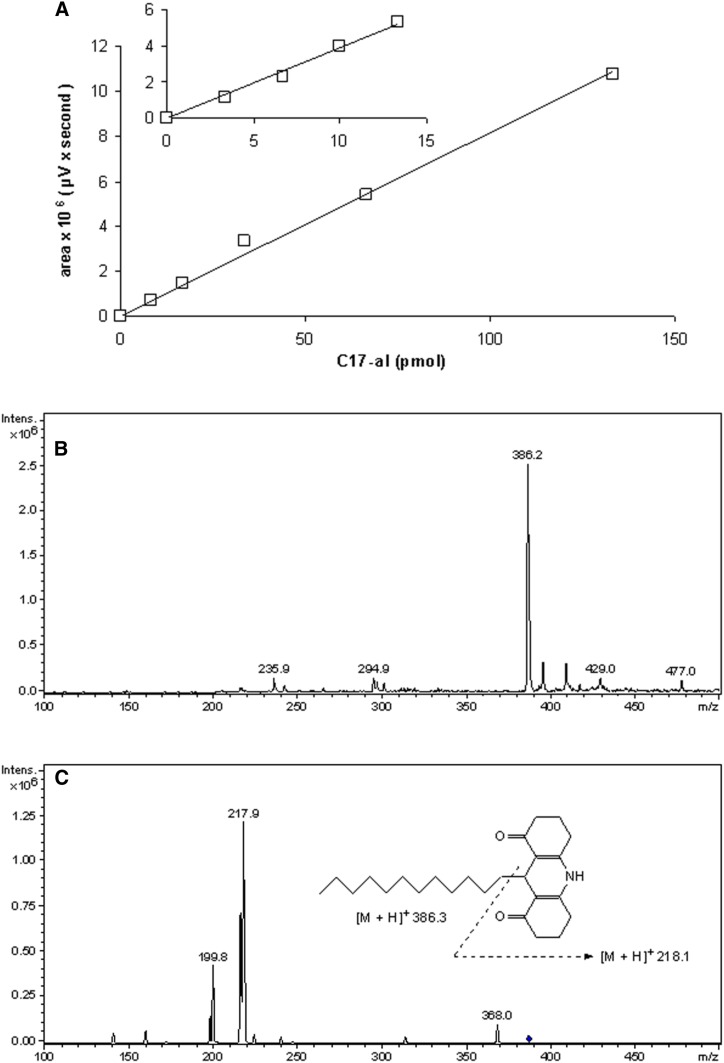
RP-HPLC and MS analyses of fluorescent derivatives. A: RP-HPLC analysis of the C17-al derivative. Integrated fluorescence peak area, obtained with EUFS setting of the detector at 3,000, was plotted versus amount of injected C17-al present in 10 μl of reaction mixture (600 μl in total). Insert shows analysis of lower amounts of aldehyde at a higher sensitivity (EUFS 1000). B: Mass spectrum scan of the C13-al derivative [positive mode, smoothed (0.2; 1; GA)]. Semi-purified derivatives were subjected to LC-ESI-MS, revealing a major ion of m/z 386.2 for the C13-al derivative (calculated mass 385.3) and m/z 442.2 for the C17-al derivative (calculated mass 441.36) (not shown). Smaller peaks represent contaminants present in both spectra. C: Fragmentation spectrum of the compound with m/z 386.2 (position indicated by diamond) with a characteristic peak at m/z 217.9, corresponding to the aromatic ring structure.

