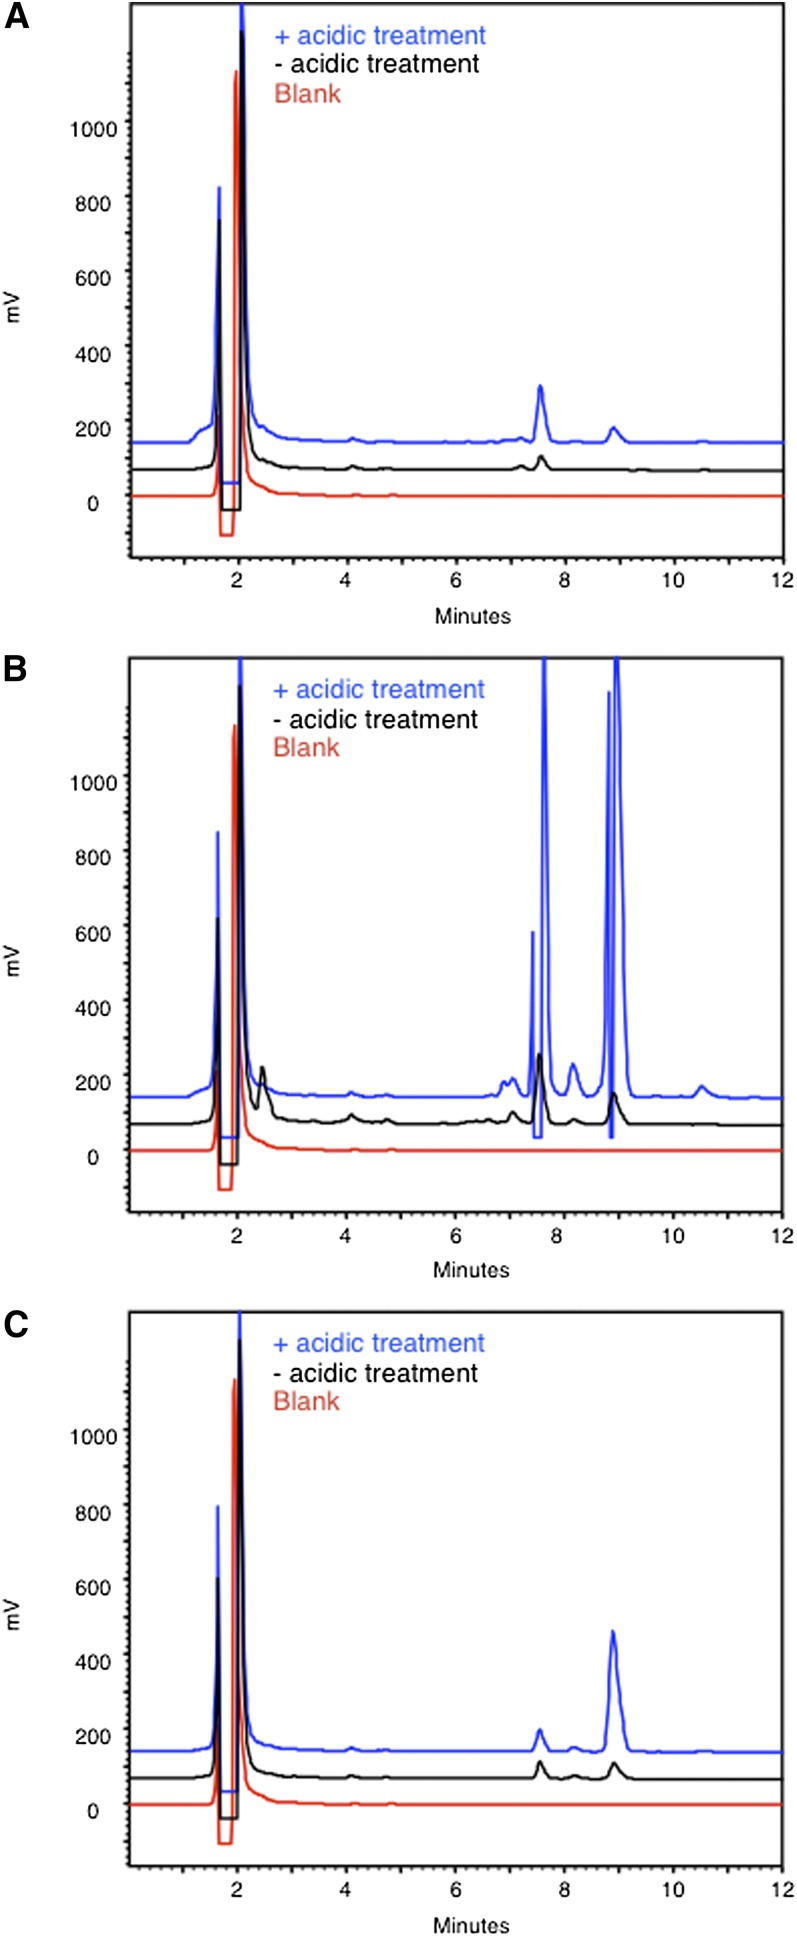
Fig. 7.
Plasmalogen cleavage. Liver homogenates (∼2 mg tissue) (A), brain homogenates (∼2 mg tissue) (B), and 1-O-1’-(Z)-octadecenyl-2-oleoyl-sn-glycero-3-phosphocholine (2 nmol) (C) were pretreated with either HCl or NaCl for 15 min at 65°C before aldehyde derivatization and separation of the fluorescent derivatives by RP-HPLC. Also a blank, containing no tissue or lipid, was analyzed. C16-al and C18-al eluted at 7.4 and 8.8 min, respectively. The drop of the blue line at 7.4 min and 8.8 min in (B) is due to a transient closure of the emission filter to protect the detector against too high intensity. The peak at 7.4 min in (C) is likely due to the presence of a contaminant in the stock solution of 1-O-1’-(Z)-octadecenyl-2-oleoyl-sn-glycero-3-phosphocholine.

