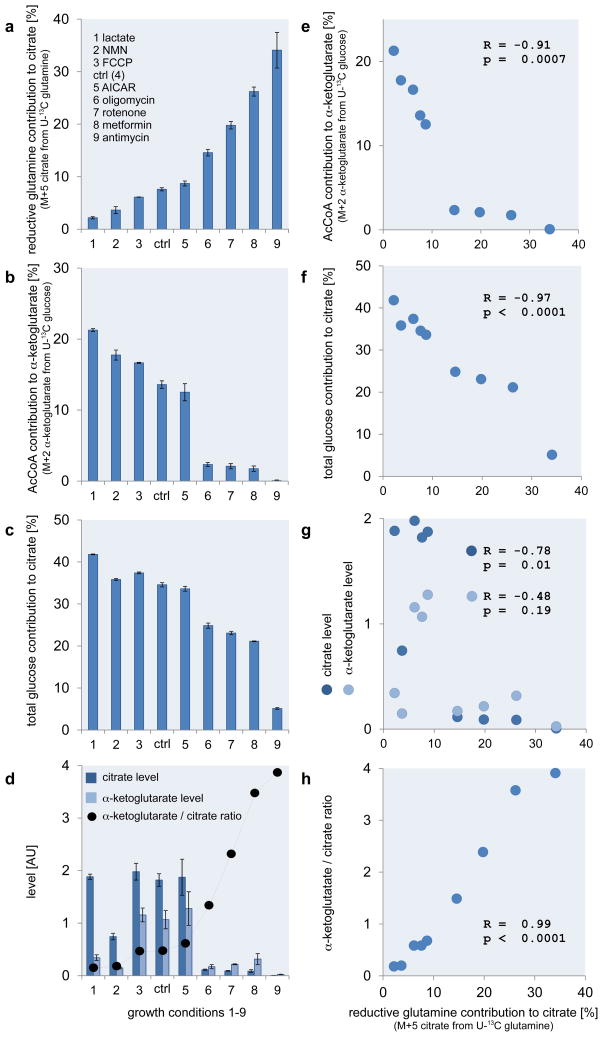
Figure 4.
Reductively derived citrate correlates with metabolic parameters in 143B cells. (a) Reductive glutamine contribution to citrate. (b) AcCoA contribution to α-ketoglutarate. (c) Total pyruvate contribution to citrate. (d) Alterations in citrate and α-ketoglutarate levels. Correlation between the reductive glutamine contribution to citrate and (e) the AcCoA contribution to α-ketoglutarate, (f) the total pyruvate contribution to citrate, (g) the relative citrate and α-ketoglutarate levels and (h) the α-ketoglutarate/citrate ratio. In case of lactate supplementation M+3 in α-ketoglutarate from U-13C glutamine instead of M+2 in α-ketoglutarate from U-13C glucose was used. Ctrl denotes standard culture condition. All error bars indicate the standard deviation. The correlation criteria were R > 0.7 or R < −0.7, and p < 0.05. All p-values (students T-test, two tailed, unequal variance) and error bars are calculated from two independent replicates.

