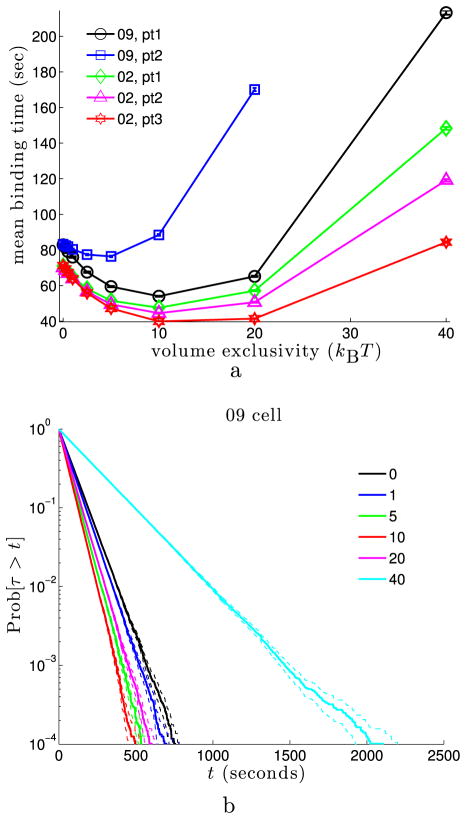
Fig. 4.
Mean binding time and survival time distribution for binding sites at fixed locations in euchromatin. (a) Mean binding time as the volume exclusivity, φmax, is varied. Inset gives the cell nucleus and target point label for each curve. Each data point was obtained from 128,000 simulations. 95 % confidence intervals are shown for each point, but often smaller than the marker size. As φmax is increased, we see each curve initially approaches a minimum before diverging to ∞. (b) Survival time distribution for the “pt1” binding site from the 09 cell nucleus. The inset gives the volume exclusivity, φmax, in units of kBT. Each curve was generated from binding time statistics for 128,000 simulations. The dashed lines about each solid curve give 95 % confidence intervals. Linearity of Pr[τ > t] with the logarithmic y-axis suggests the binding time is approximately exponential (Color figure online)

