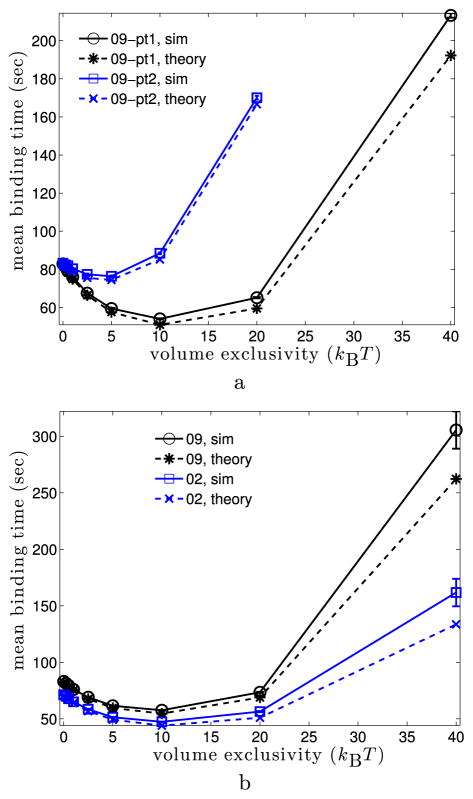
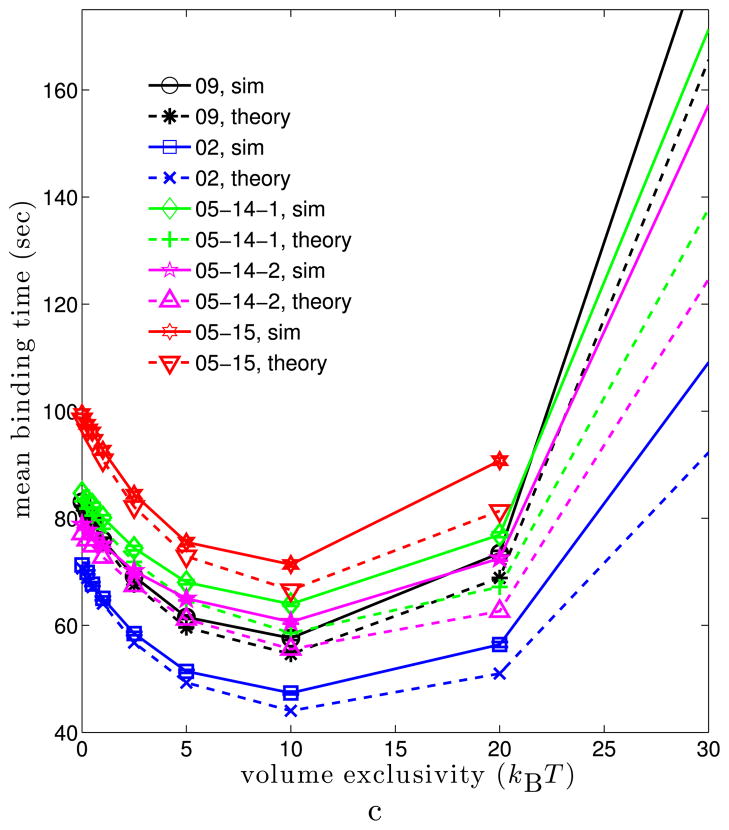
Fig. 7.
Theoretical mean binding times (16) and (19) versus those from simulations. Note that both theoretical mean binding times involve no fitting to the simulated times, and are completely determined by known parameters. In all figures, solid lines give the mean binding times from simulations, while dashed lines give the corresponding theoretical prediction. (a) 09 cell for the two fixed targets used in Fig. 4(a). Theoretical mean binding times are from (16). (b) 09 and 02 cells with binding sites randomly localized in euchromatin (20th to 30th percentile of LAC distribution). Simulated means are those from Fig. 5(b), while theoretical are from (19). (c) All five nuclei when binding sites are randomly localized in regions of euchromatin (20th to 30th percentile of the LAC distribution). Simulated means are the same is in Fig. 5(b), while theoretical are from (19) (Color figure online)


