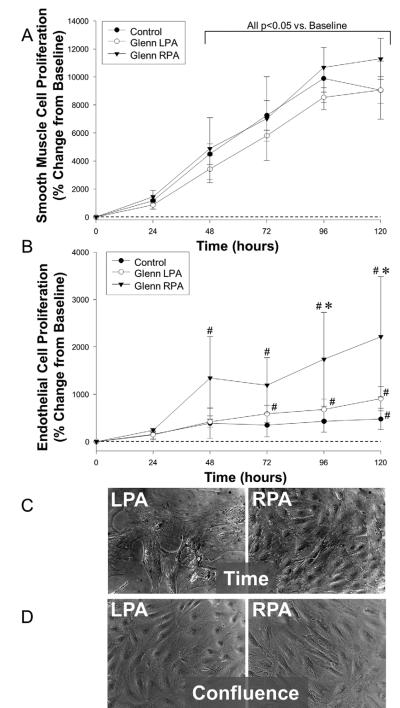
Figure 2.
A. Proliferation of SMCs from the LPA, RPA and controls expressed as a change from the 24 hour time point (set to zero). There were no differences between the LPA and the RPA (# p<0.05 vs. “time 0”).
B. Proliferation of RPA ECs was higher than the LPA and controls (*p<0.05 vs. LPA; # p<0.05 vs. “time 0”).
C. Photomicrographs of ECs from the LPA and RPA at similar confluence.
D. Photomicrographs of ECs from the LPA and RPA pig at 5 days after plating.

