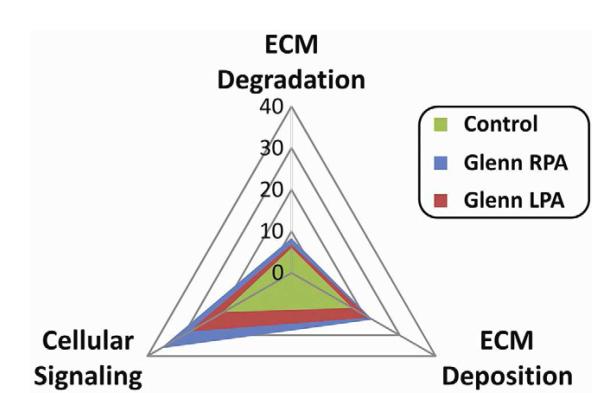
Figure 4.
Radar plot showing relative gene expression profiles for genes related to ECM degradation, ECM deposition, and cellular signaling. The plot for the LPA (plane defined by the red triangle) and control (plane defined by the green triangle) was clearly different than the plane defined for the RPA (blue triangle). Fold expression levels for the genes that resulted in this plot are summarized in Appendix Table 1.

