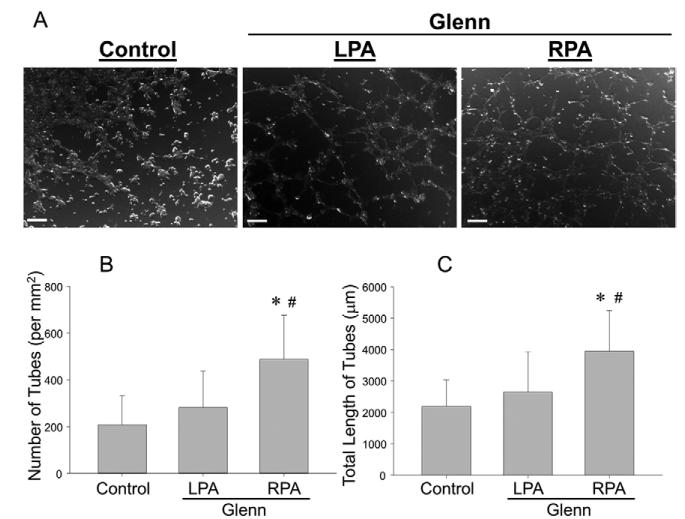
Figure 5.
A. Photomicrographs of ECs from the LPA, RPA and controls 3 hours after plating. Cells from the LPA (left) and controls assembled into a number of nodes and tubule extension had commenced as evidenced by thin structures between nodes. In contrast, cells from the RPA – at the same time point – had assembled into a well-defined network structure between nodes, consistent with a more pro-angiogenic phenotype. Number of tubes (B) and total length of tubes (C) were higher in the RPA than in the LPA (*p<0.05 vs. LPA).

