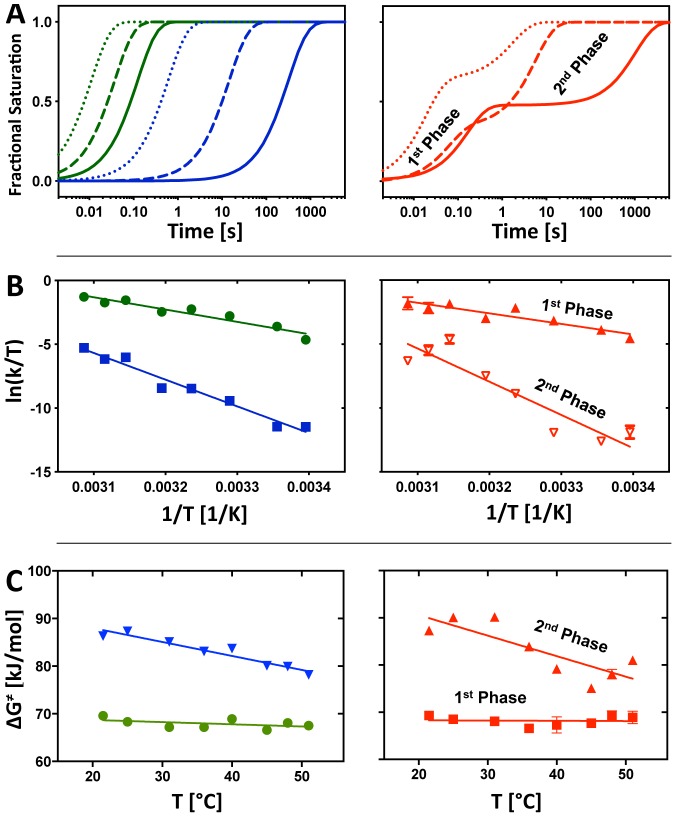
Figure 3. Analysis of cluster centroids.
(A) The left and right panel show the simulated time progression curves derived from the global fit of cluster centroids to equation (3). The time progression of the fast (green), slow (blue), intermediate (red) cluster are shown at 25°C (solid line), 40°C (dashed line), and 51°C (dotted line). The fast and slow folding clusters are monophasic (left) whereas the intermediate cluster is biphasic. (B) The kinetic rate constants of the fast (left panel, green), slow (left panel, blue), and intermediate (right panel) cluster centroids are presented in the Eyring plots. The errors are small and visible as bars if they do not overlap the symbol. The linear fits reveal information about the entropy and enthalpy of activation during structuring of the P4–P6 domain, the core, and the peripheral elements. The free energy of activation was derived from eq. (4). Values for ΔH ‡, ΔS ‡ and ΔG ‡ are summarized in Table 1. The first and second phase of the intermediate cluster centroids are processed separately as shown in the right panel. (C) Temperature dependence of ΔG ‡. The left panel shows data points and linear fits for the fast (green circles) and slow (blue inverted triangles) cluster centroids, the right panel shows the corresponding analysis for the individual phases of the centroid associated with the medium cluster (fast phase, red squares; slow phase, red triangles).

