
Figure 5. Cumulative probability of death in the Estonian Biobank cohort by percentiles of the biomarker summary score.
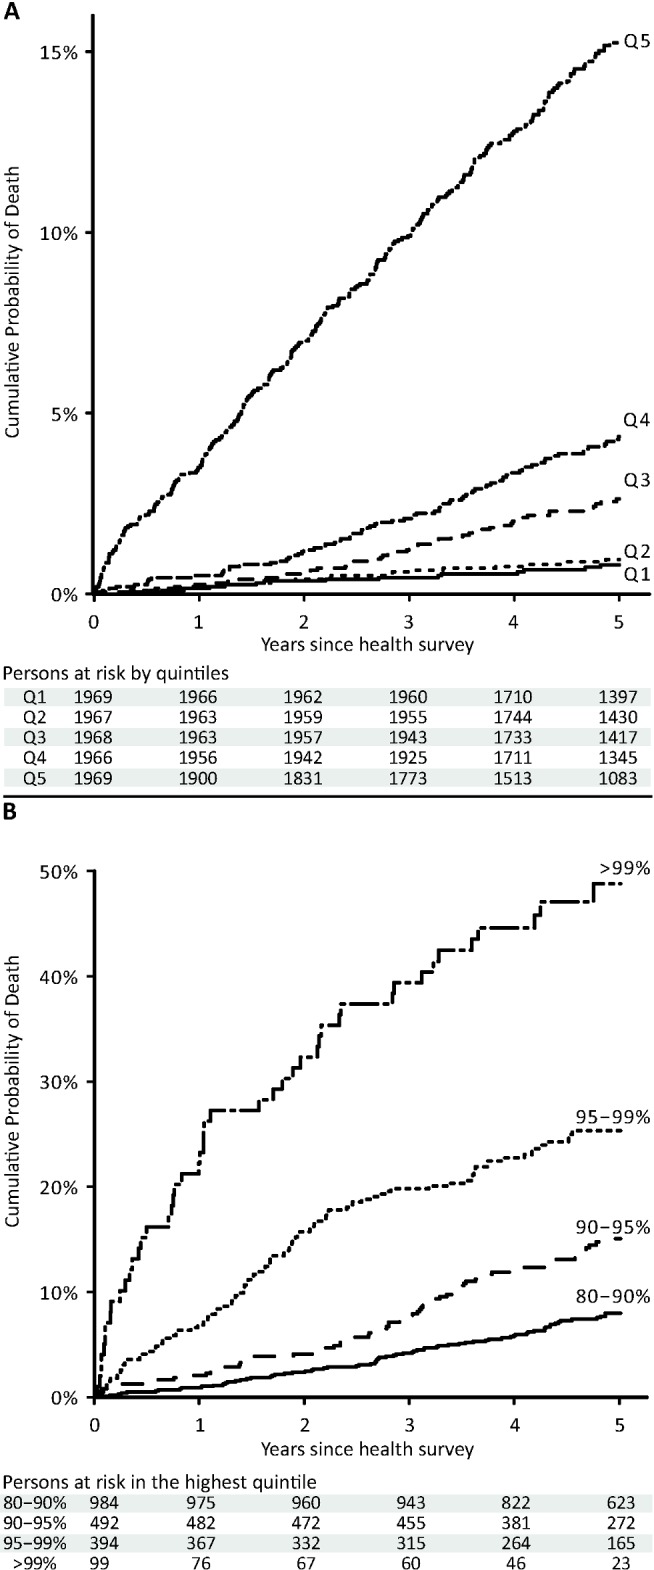
The 5-y cumulative mortality is shown per quintile of the biomarker summary score (A) and with further stratification of the highest quintile (B).