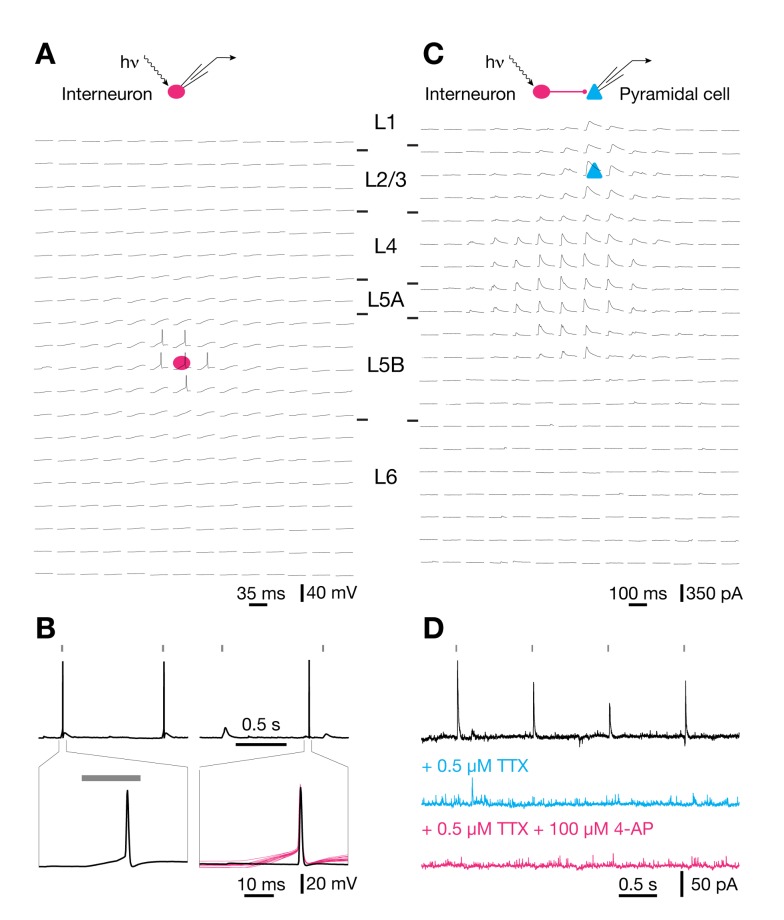
Figure 1. Optogenetic mapping of inhibitory connectivity.
(A) Optical raster stimulation of GABAergic interneurons; electrophysiological recording from a L5B interneuron. Whole-cell current-clamp traces show light-evoked voltage responses as the focus of the stimulating beam is scanned across a grid of 14×20 locations. The somatic position of the recorded interneuron is indicated by a red ellipse; the grid spacing is 60 µm. Only perisomatic illumination evokes action potentials. (B) Waveforms of light-evoked (left) and spontaneous (right) action potentials at different timescales (top, bottom). Note that a slow depolarizing ramp to threshold after the onset of a light pulse (20 ms, gray bars) distinguishes light-evoked from spontaneous action potentials. The bottom right panel includes for comparison traces of all 15 light-evoked action potentials elicited during three repetitions of a raster scan (red traces, aligned to the time at which the rising action potential reached half-maximal amplitude). (C) Optical raster stimulation of GABAergic interneurons; electrophysiological recording from a L2/3 pyramidal cell. Whole-cell voltage-clamp traces show light-evoked IPSCs as the focus of the stimulating beam is scanned across a grid of 14×20 locations. The somatic position of the recorded pyramidal cell is indicated by a blue triangle; the grid spacing is 60 µm. (D) Waveforms of light-evoked IPSCs in a pyramidal cell voltage-clamped at 0 mV. IPSCs are blocked by bath application of TTX (blue) and fail to recover after additional application of 4-AP (red).

