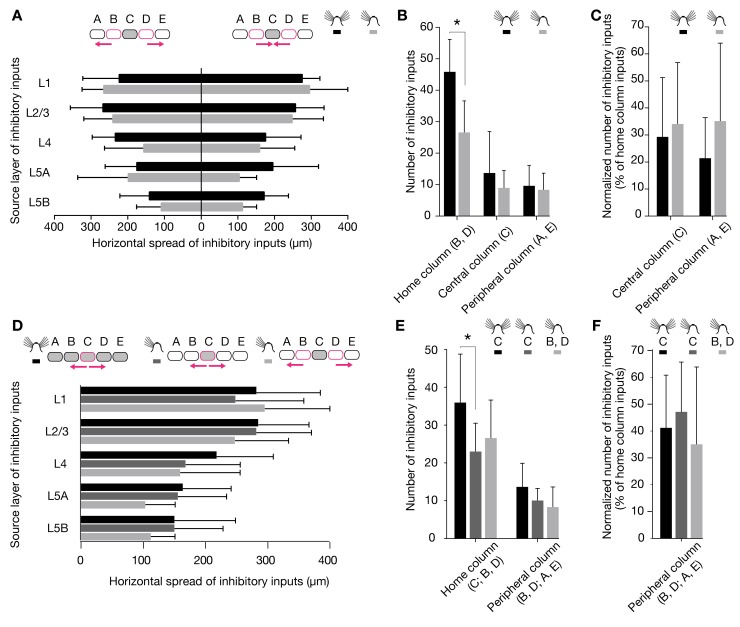
Figure 4. Horizontal distribution of inhibitory inputs among barrel-related columns.
(A–C) Recordings were obtained from L2/3 pyramidal cells in barrel-related columns B (n = 4 cells in control and 2 cells in deprived conditions) or D (n = 8 cells in control and 15 cells in deprived conditions). (A) Average horizontal distance of the most distant inhibitory input from the center of the home column in the indicated layers. The left bar graph shows the horizontal spread of inhibitory inputs from the peripheral columns A or E, which represent trimmed whiskers; the right bar graph shows the horizontal spread of inhibitory inputs from the central column C, which represents an intact whisker. Black columns, control condition; gray columns, deprived condition; error bars represent 1 SD. No significant differences exist between any of the groups (p>0.05, t test). (B) Absolute numbers of connected locations in the home column; the peripheral columns A or E, which represent trimmed whiskers; and the central column C, which represents an intact whisker. Black columns, control condition; gray columns, deprived condition. Error bars represent 1 SD; the asterisk indicates a significant difference (p<0.05; t test). (C) Same display as (B), but depicting connected locations normalized to the number of locations in the home column. No significant differences exist between conditions (p>0.05, t tests). (D–F) Recordings were obtained from L2/3 pyramidal cells in barrel-related column C (n = 13 cells in control and 12 cells in deprived conditions). (D) Average horizontal distance of the most distant inhibitory input from the center of the home column in the indicated layers. The bar graph shows the horizontal spread of inhibitory inputs toward columns representing trimmed whiskers. Black columns, control condition; dark gray columns, spread from spared column C to deprived columns B or D; light gray columns, spread from deprived columns B or D to deprived columns A or E; error bars represent 1 SD. The data set depicted in light gray is reproduced from panel A. No significant differences exist between any of the groups (p>0.05, t test). (E) Absolute numbers of connected locations in the home column and an adjacent deprived column. Black columns, control conditions; dark gray columns, column representing an intact whisker in otherwise deprived conditions; light gray columns, column representing a trimmed whisker in deprived conditions. Error bars represent 1 SD; the asterisk indicates a significant difference (p<0.05; t test). (F) Same display as (E), but depicting connected locations normalized to the number of locations in the home column. No significant differences exist between any of the groups (p>0.05, t tests).

