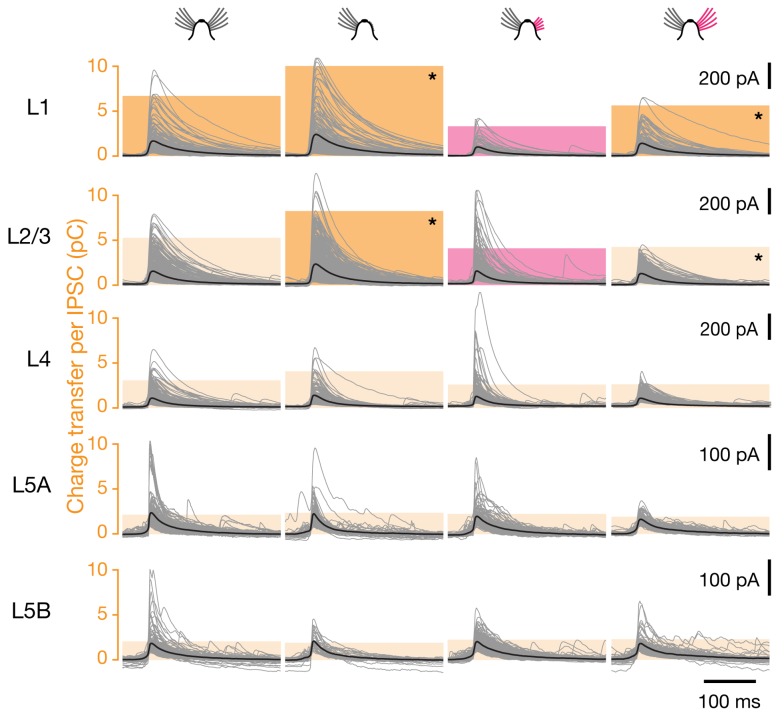
Figure 9. Sensory deprivation causes motif-specific changes in inhibitory connection strength.
Voltage-clamp recordings at a holding potential of 0 mV from L2/3 pyramidal neurons in barrel-related columns representing intact (left, n = 23), trimmed (center left, n = 23), or previously deprived whiskers after regrowth for 1 mo (center right, n = 19) or 3 mo (right, n = 17). IPSCs were evoked by optical stimulation of interneurons in the indicated cortical layers; traces of all individual IPSCs (gray) were aligned to the time at which the rising IPSC reached half-maximal amplitude. Bold black traces indicate group averages. Colored columns represent the mean integrated current (charge transfer) per IPSC. Red columns mark significant differences associated with partial whisker regrowth (p<0.05; ANOVA); dark yellow columns indicate groups whose means differ from the state of partial whisker regrowth (Bonferroni-corrected t test). Asterisks mark pairwise differences remaining after whisker regrowth for 3 mo (p<0.05; ANOVA followed by Bonferroni-corrected t test). See also Figure S3 and Figure S4.

