Fig. 8.
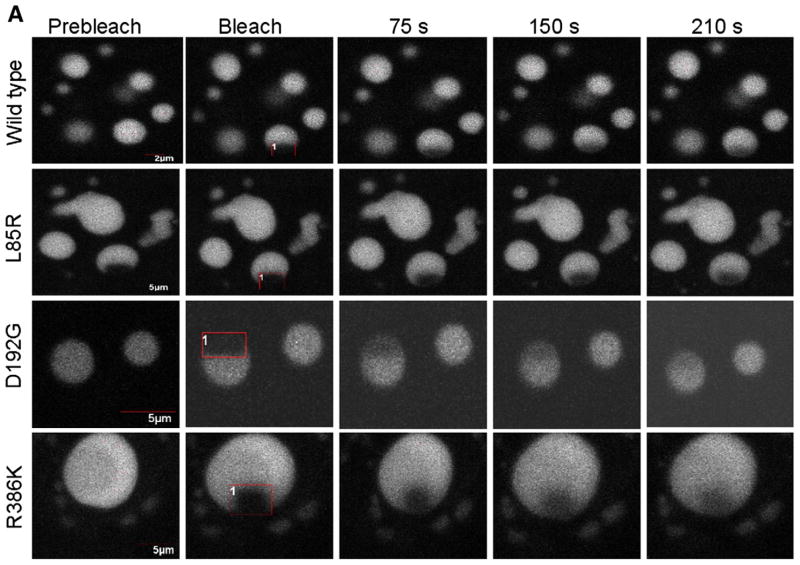
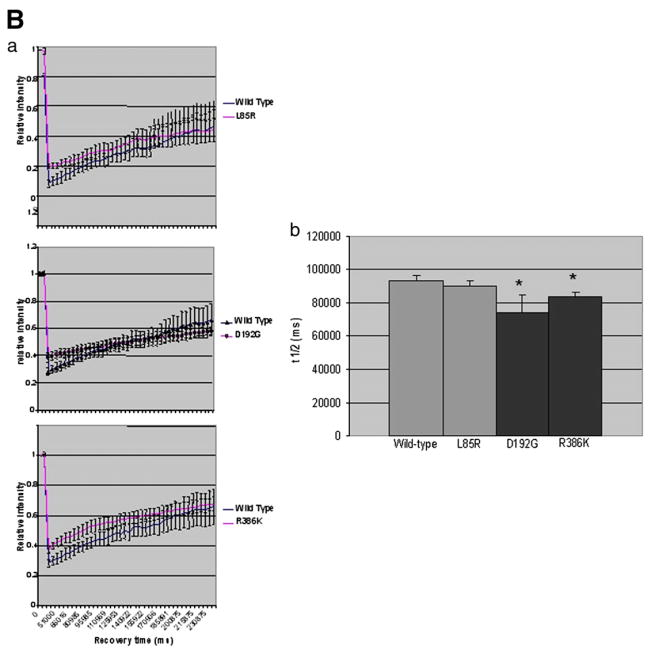
A. FRAP experiments on wild type and L85R, D192G and/or R386K lamin C nuclear aggregates of COS7 cells. The boxed regions were bleached and the fluorescence recovery was monitored over a 210 s period. B. Quantitative experiments showing normalized fluorescence recovery after photobleaching of a targeted region of the lamin C nuclear aggregates in COS7 cells. (a) The fluorescence intensity in the bleached area is expressed as a relative recovery. Error bars indicates SEM, n=7. 1 is the level of fluorescence before bleaching. (b) We assessed the time after photobleaching required for fluorescence to recover the median value between the prebleach and just after the bleach (t1/2) as a mean to reflect the dynamics of molecule.


