Figure 4.

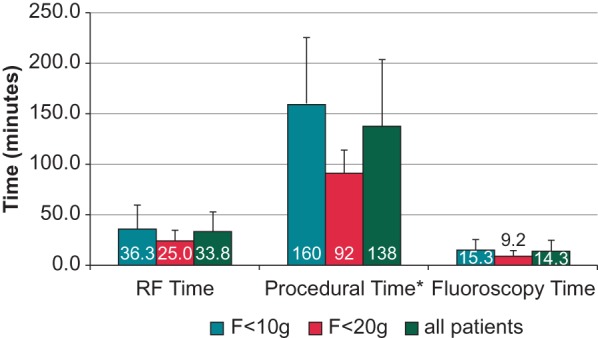
Radiofrequency (RF) time, fluoroscopy time, and procedural time in the overall population and in the two subgroups with CF < 10 g and >20 g, respectively. *P < 0.05

Radiofrequency (RF) time, fluoroscopy time, and procedural time in the overall population and in the two subgroups with CF < 10 g and >20 g, respectively. *P < 0.05