Figure 1.
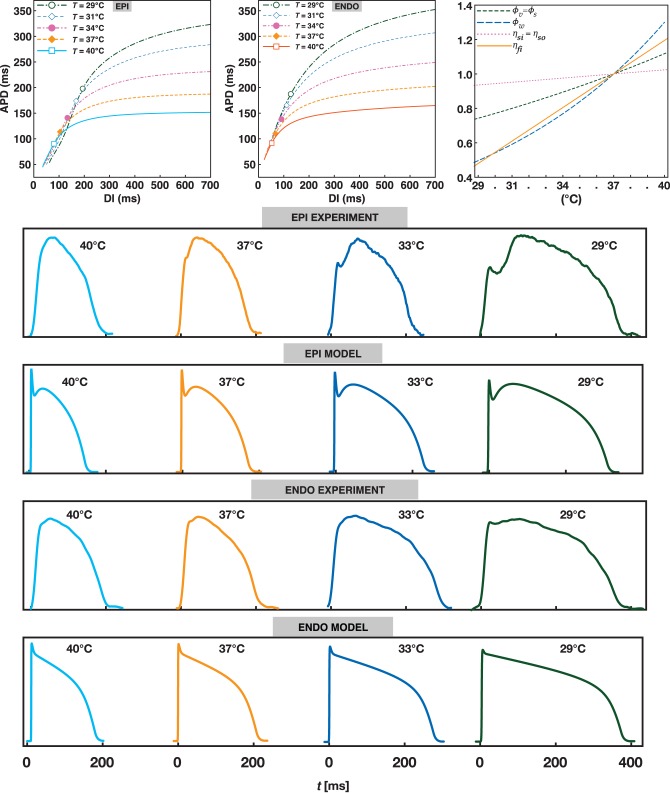
(Top row left-centre) Restitution curves for EPI, ENDO tissue models were obtained using 1D cables of 4 cm in length at five different temperatures: 29, 31, 33, 37, 40°C. Symbols indicate where the curves' slope becomes >1. (Top row right) Variation of temperature-dependent factors multiplying the ionic currents and the gating variables as reported in Eqs. (8) and (9). The x-axis highlights the simulated temperatures for both ENDO and EPI. (Bottom four rows) Representative experimental and numerical traces for APs at 900 ms CL stimulation for epicardial and endocardial surfaces at T = 40, 37, 33, 29°C. Differences in shapes are due to various effects such as optical signal average from full 3D experiments in the presence of heterogeneity and fibre rotation anisotropy. Simulations refer to 2D homogeneous and isotropic domains.

