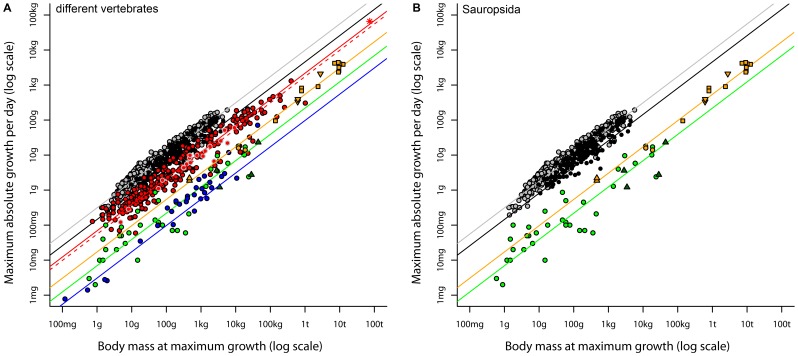
Figure 1. Regressions of maximum absolute growth rate (AGR) against body mass at maximum growth (BMatMG) for (A) different vertebrate groups and (B) for sauropsids only.
Grey = altricial birds; black = precocial birds; red = mammals, red circles with black contour = eutherians, red circles with grey contour = marsupials, red star = blue whale; green = reptiles, dark green triangles = crocodiles; blue = fish; orange = dinosaurs, orange squares = sauropodomorphs, orange triangles upside down = theoropds, orange triangles = Archaeopteryx, orange circles = Psittacosaurus. Lines shown are regression lines with a slope forced to 0.75 (consistent with our empirical findings and with theory). For values of the intercepts see Table 2. Data on growth rate and body mass of the blue whale are from Case [9]. Please note that the blue whale was not used to establish our regression model on mammals. Also, crocodiles were not used to establish our regression model on reptiles. Crocodiles were not included in the phylogeny of reptiles, which was needed for PGLS.

