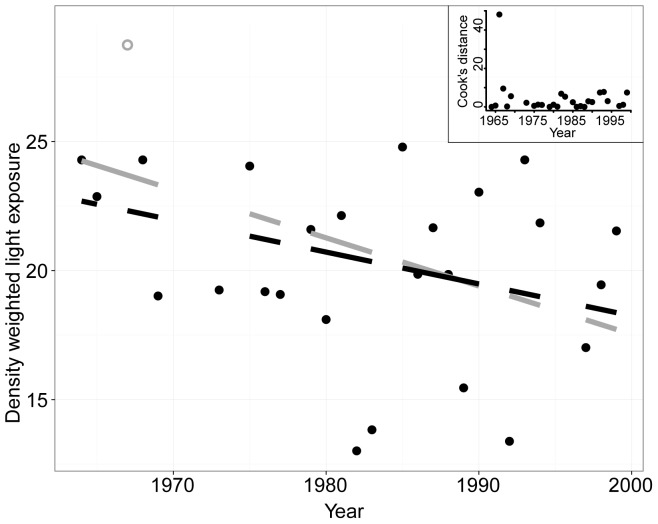
Figure 6. Change in density-weighted light exposure through time for diatoms between 1964 and 1999.
Secchi data are available from 1964 forward, and diatom records are available beginning in 1951. A preservation change occurred in 1973, from formalin to Lugol's, and while a step change in diatom abundance is not apparent, results should be interpreted cautiously. The linear regression was fit with (grey line; P = 0.02) and without (black line; P = 0.09) the data point for 1966 (grey open circle). Cook's distance was also plotted for each point (inset), demonstrating the importance of the 1966 data point in influencing the results of the regression.

