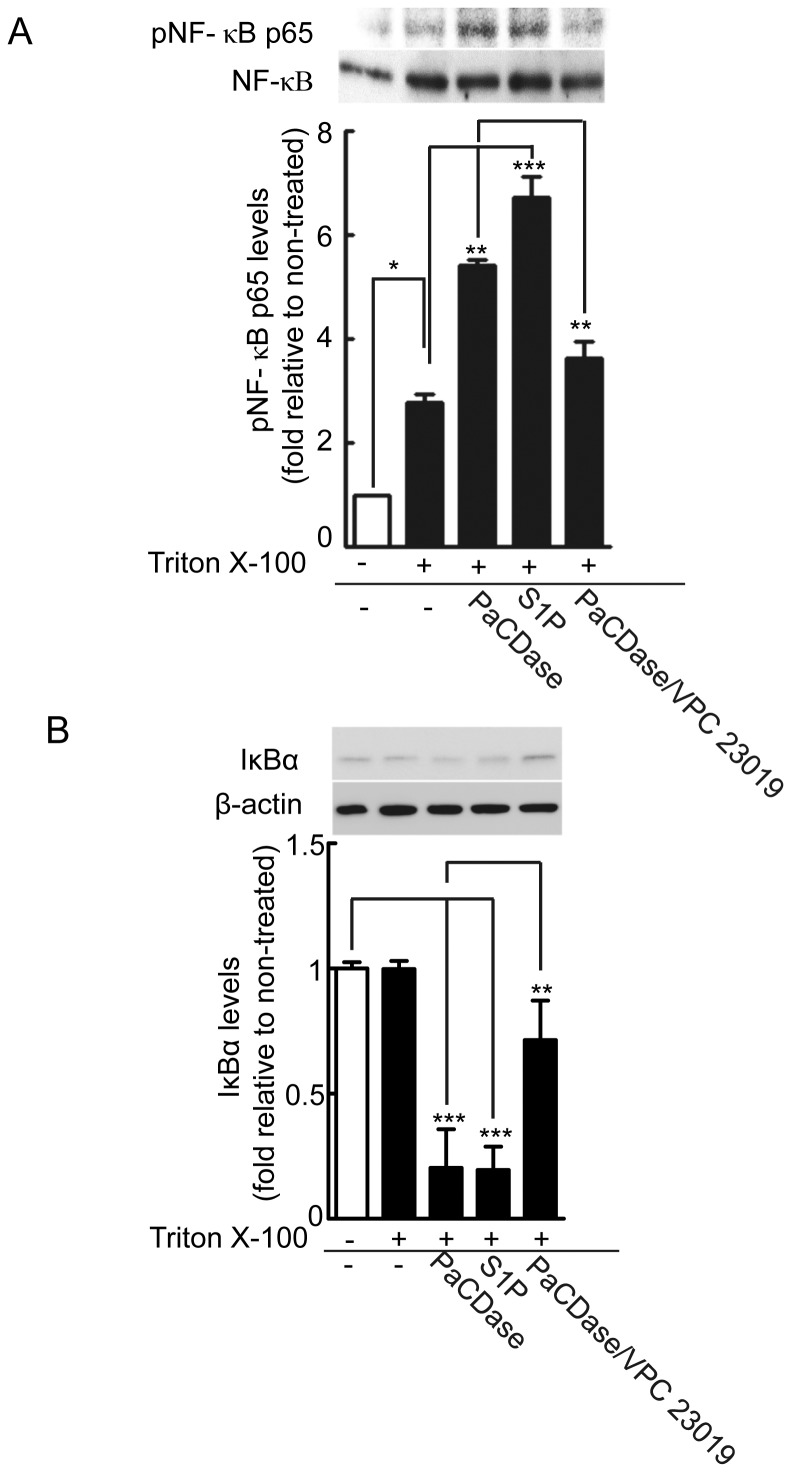
Figure 6. PaCDase and S1P activate NF-κB-dependent signal pathway.
(A) PaCDase and S1P significantly increase phosphorylated NF-κB p65 levels. Nitrocellulose filters with Tris-buffered saline (-/-) or Tris-buffered saline plus 0.1% Triton X-100 alone (−/+) or with 1 mU/ml PaCDase (PaCD/+), 5 µM S1P (S1P/+), or 1 mU/ml PaCDase with 10 µM VPC 23019 (PaCD/VCP23019/+) were placed onto the stratum corneum and incubated for 4 h. The cells were washed and solubilized, lysates were cleared by centrifugation, and the equivalent amounts of protein of the supernatants were subjected to SDS-PAGE/immunoblotting with anti-phospho-NF-κB p65 (Ser536). To determine the amount of NF-κB p65 in each band, the membranes were re-probed with anti-NF-κB p65. The blots shown are representative of 3 independent experiments. The band intensity of phosphorylated NF-κB p65 is shown relative to that of NF-κB p65 in each lane. The data are expressed as the ratio relative to control (-/-) and represent the mean±SD of 3 independent experiments. *P<0.05; **P<0.01; ***P<0.001. (B) PaCDase and S1P decrease IκBα protein concentration in cytosolic extracts in keratinocytes. The cells were incubated for 4 h as described in (A), washed and solubilized, the lysates were cleared by centrifugation, and the supernatants were subjected to SDS-PAGE/immunoblotting with anti- IκBα. To determine the amount of IκBα in each band, the membranes were re-probed with anti-β-actin. The blots shown are representative of 3 independent experiments. The band intensity of IκBα is shown relative to that of βactin in each lane. The data are expressed as the ratio relative to control (-/-) and represent the mean±SD of 3 independent experiments. **P<0.01; ***P<0.001.

