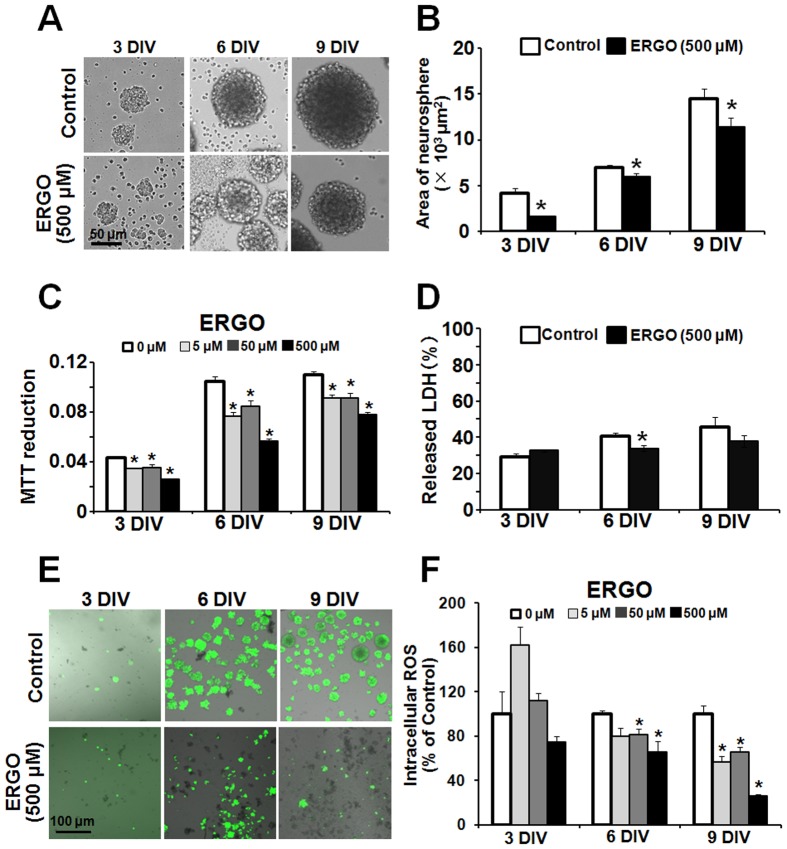
Figure 2. Effect of ERGO on proliferation of mouse cultured cortical NPCs.
(A) NPCs were exposed to ERGO (500 µM) for 3 to 9 DIV, and (B) the area of neurospheres was quantified by using ImageJ. Each value represents the mean ± S.E.M. (n = 14). (C) Mitochondrial activity was measured by MTT assay in NPCs exposed to ERGO (0–500 μM) for 3 to 9 DIV. Each value represents the mean ± S.E.M. (n = 4). (D) Cytotoxicity was measured by LDH assay in NPCs exposed to ERGO (500 µM) for 3 to 9 DIV. Each value represents the mean ± S.E.M. (n = 3–4). (E) Intracellular ROS was determined by imaging with CM-H2DCFDA in NPCs exposed to ERGO (500 μM) for 3 to 9 DIV. (F) Intracellular ROS was quantified with ImageJ. The population of neurospheres showing a strong signal was measured with ImageJ. Each value represents the mean ± S.E.M. (n = 4). *P<0.05, significant difference from the control value.

