
Figure 3. Comparison of proliferative activity between ERGO and other antioxidants.
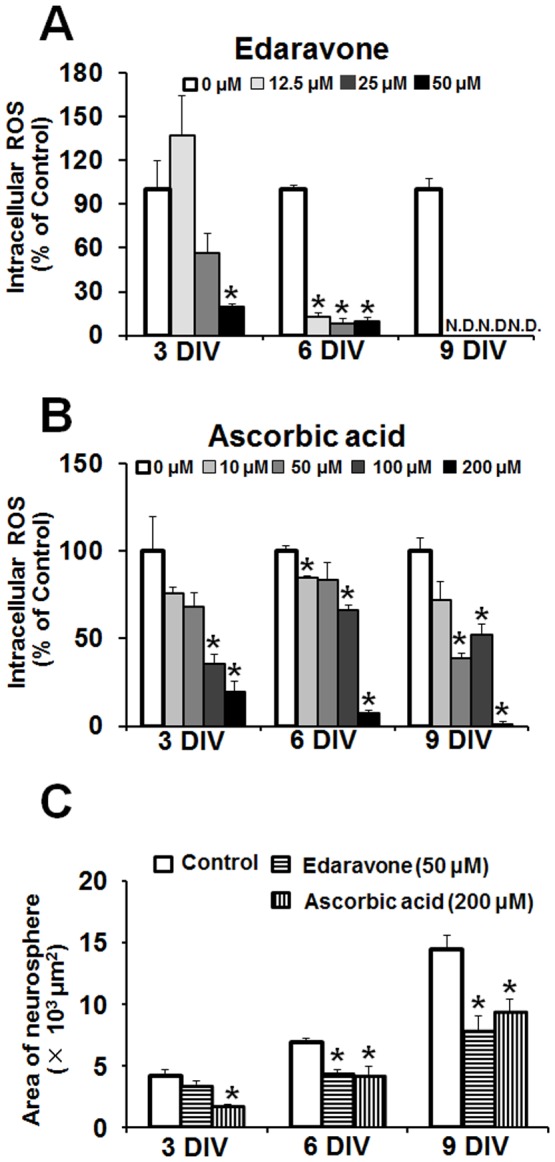
Intracellular ROS was determined by imaging with CM-H2DCFDA in NPCs exposed to edaravone (A) and ascorbic acid (B) for 3 to 9 DIV. Each value represents the mean ± S.E.M. (n = 3–4). In panel (C), the area of neurospheres was measured with ImageJ in NPCs cultured in either the presence or absence of edaravone (50 μM) or ascorbic acid (200 μM) for 3 to 9 DIV. *P<0.05, significant difference from the control value obtained in NPCs incubated in the absence of antioxidants. N.D., not detectable.