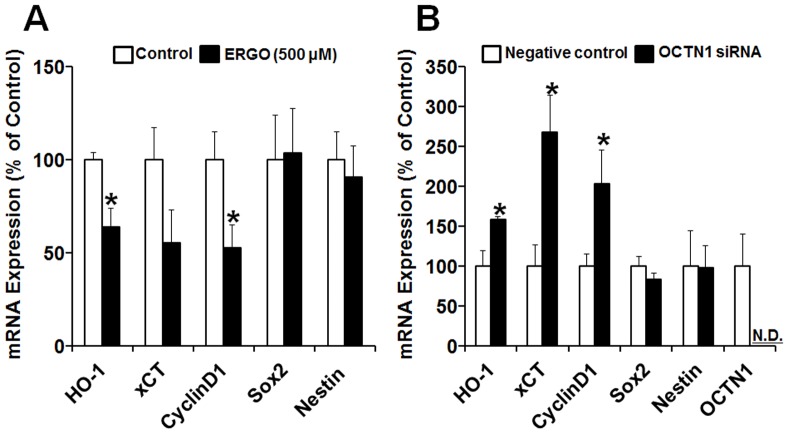
Figure 5. Effects of ERGO and OCTN1 knockdown on expression of proliferation-related genes in NPCs.
(A) Mouse cultured cortical NPCs were exposed to ERGO (500 µM) for 9 DIV, and total RNA was extracted for quantitative RT-PCR analysis. Each value is normalized by the expression level of 36B4 mRNA and represents the mean ± S.E.M. (n = 5–6). *P<0.05, significant difference from the corresponding control value. (B) P19-NPCs were transfected with negative control siRNA (white columns) or siOCTN1 (black columns), and total RNA was extracted for quantitative RT-PCR analysis. Each value is normalized by the expression level of GAPDH mRNA and represents the mean ± S.E.M. (n = 3–8). *P<0.05, significant difference from the corresponding control value. N.D., not detectable.

