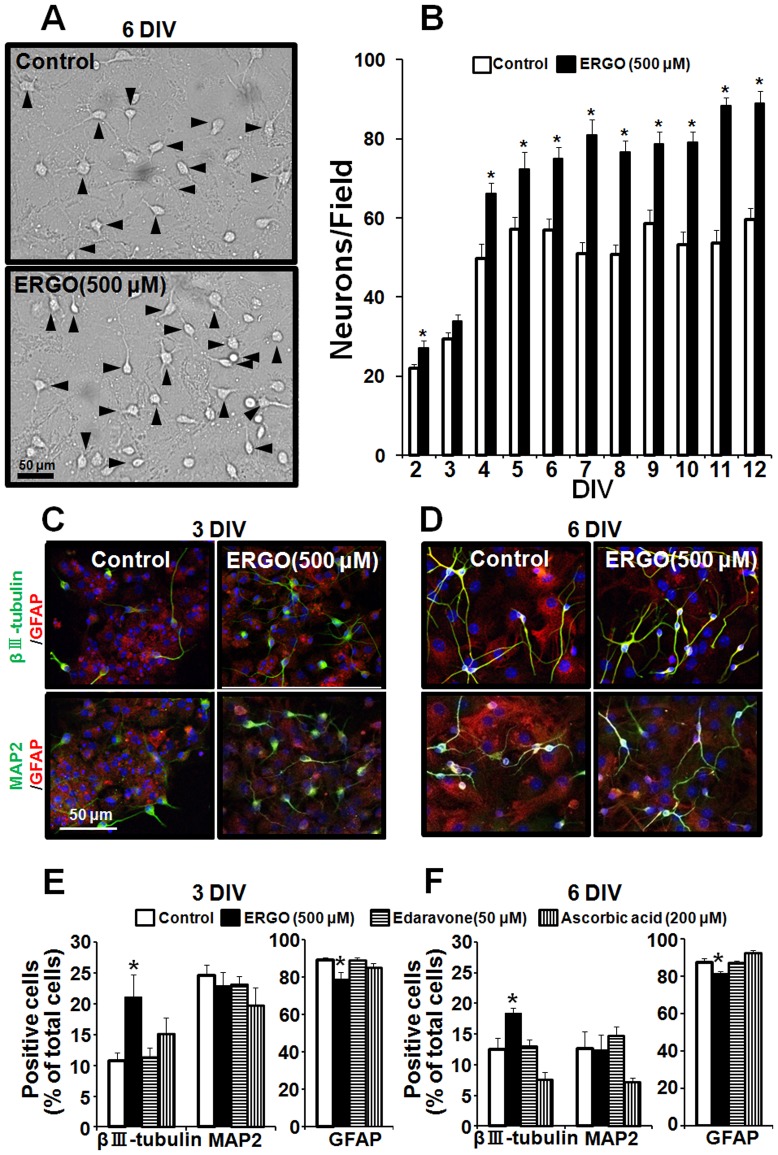
Figure 6. Effect of ERGO on differentiation in mouse cultured NPCs.
NPCs were exposed to ERGO and other antioxidants for 9(A) Typical phase-contrast micrographs are shown. Black arrowheads represent differentiated neuron-like cells with neurites longer than the cell diameter. (B) The numbers of differentiated cells per field were counted for quantitative analysis in NPCs exposed to ERGO (black columns) or control (white columns). Each value represents the mean ± S.E.M. (n = 12). (C, D) NPCs exposed to ERGO (500 µM) for 9 DIV were induced to differentiate by adhesion culture for 3 or 6 DIV, and the cells were fixed with 4% PA, followed by immunocytochemical detection of immature neuronal marker βIII-tubulin (green), mature neuronal marker MAP2 (green), astroglial marker GFAP (red) and nuclear marker DAPI (blue). (E, F) NPCs exposed to each antioxidant for 9 DIV were induced to differentiate by adhesion culture for 3 or 6 DIV, and the numbers of cells positive for each marker were counted by using ImageJ and normalized by the number of DAPI-positive cells. Each value represents the mean ± S.E.M. (n = 6). *P<0.05, significant difference from the corresponding control value.

