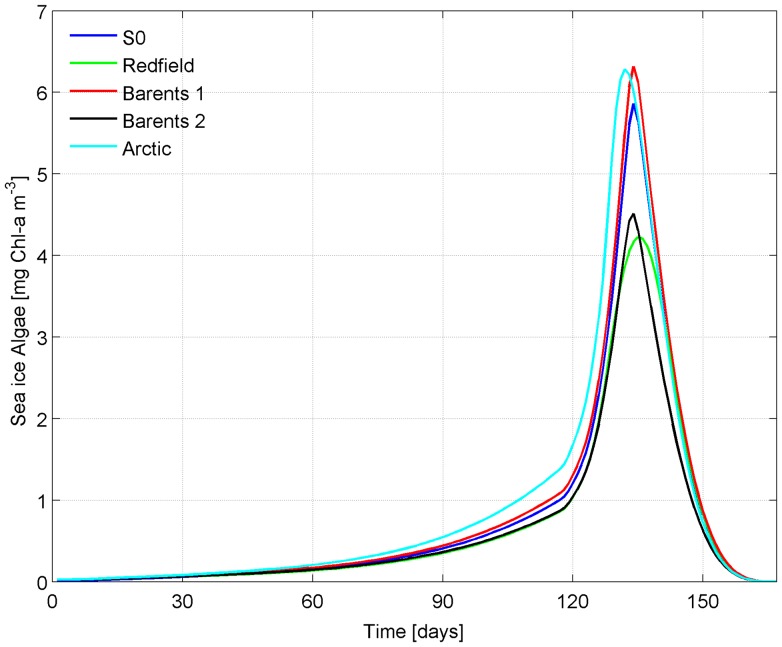
Figure 8. Chl comparison between the standard model of[25] and the simplified model described in this work.
Chl comparison between the normal idealized case (S0) produced by the simplified model presented in this work, and by the more comprehensive model of [25] when nutrients are initialized: i) with Redfield ratio with respect to silicate (15 Si: 16 N: 1 P), ii) with non-Redfield values reported from the Barents Sea (Barents 1 = 8 mmol Si  ; Barents 2 = 6 mmol Si
  ), and iii) using average values reported for the entire Arctic Ocean.

