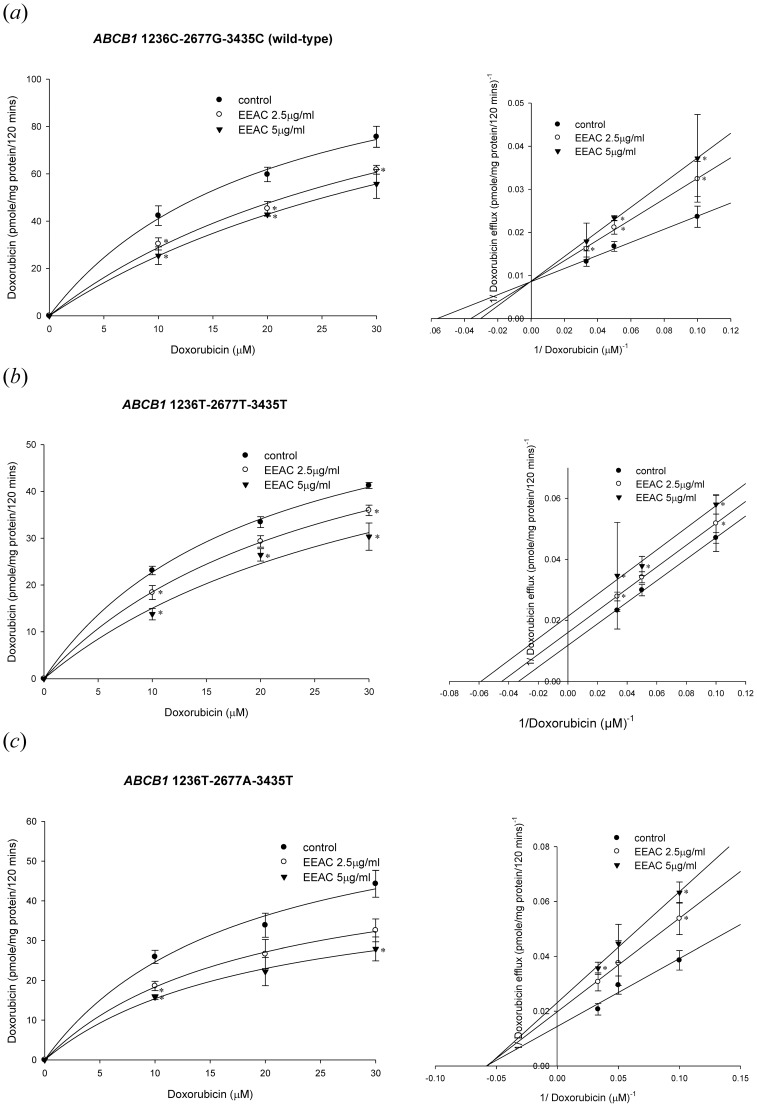
Figure 5. Concentration-dependent doxorubicin efflux (10–30 µM) in the presence or absence of EEAC.
The left panels showed the nonlinear regression analysis of doxorubicin efflux and the right panels demonstrated the Lineweaver-Burk plot analysis of doxorubicin efflux. (a) Wild-type P-gp (1236C-2677G-3435C). (b) Variant-type P-gp (1236T-2677T-3435T). (c) Variant-type P-gp (1236T-2677A-3435T). Data were presented as mean ± SE of at least three experiments, each in triplicate. *p<0.05 as compared to doxorubicin efflux without EEAC (control).

