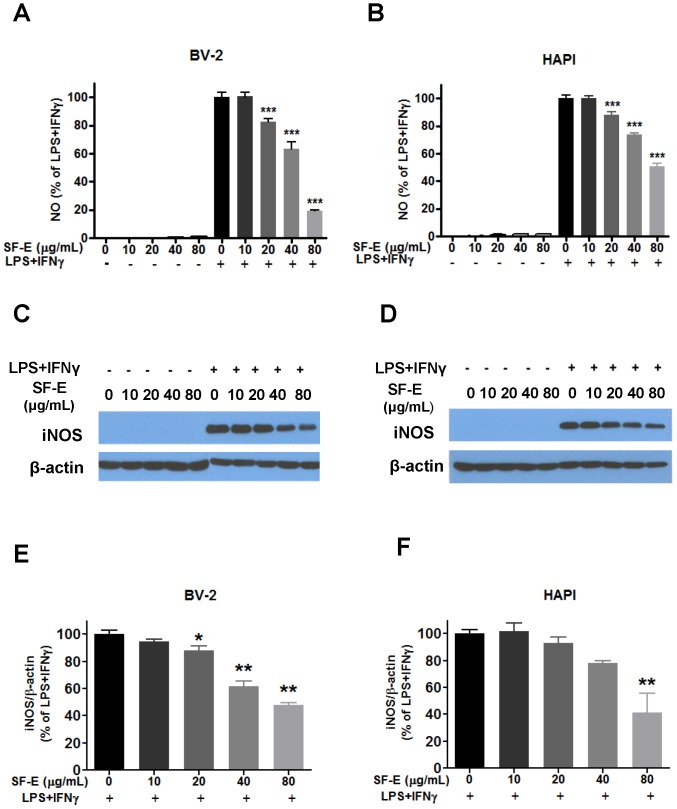
Figure 3. SF-E inhibits LPS+IFNγ-induced NO production and iNOS expression in microglial cells.
(A-B) Cells were treated with SF-E (0 to 80 µg/mL) for 1 h followed by stimulation with LPS (100 ng/mL) and IFNγ (10 ng/mL) for 16 h. Culture media were collected for determination of NO using the Griess reaction protocol as described in the text. (C-D) Representative Western blots depicting LPS+IFNγ-induced iNOS protein expression in BV-2 and HAPI microglial cells incubated in the presence and absence of SF-E. (E-F) Bar graphs representing iNOS/β-actin ratios using LPS and IFNγ as control (100%). Results are expressed as the mean ± SEM (n = 7) and significant differences from the respective LPS+IFNγ stimulated group was determined by one-way ANOVA followed by Dunnett’s tests, *p<0.05; **p<0.01.

