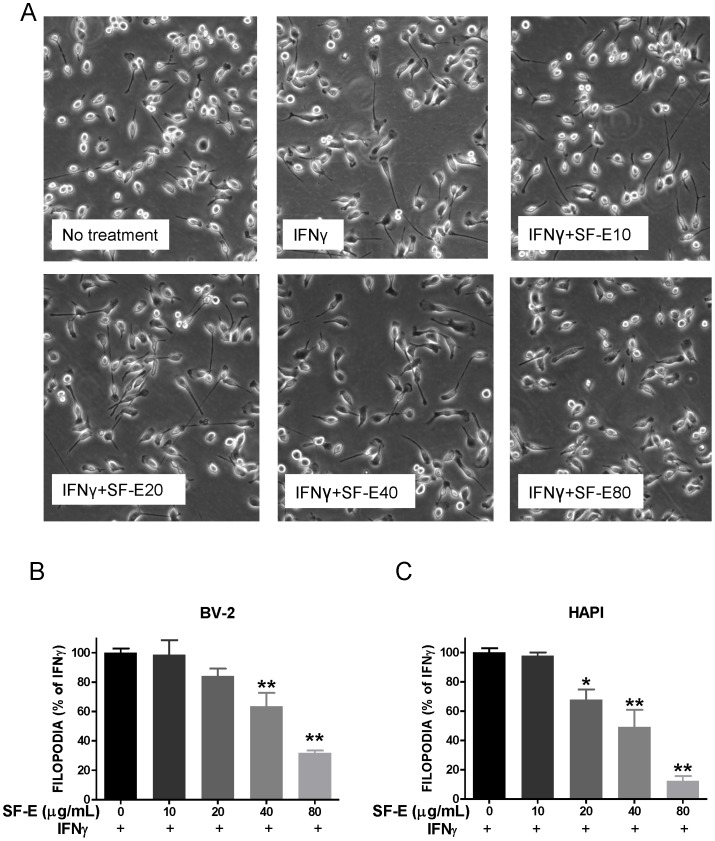
Figure 7. SF-E inhibits IFNγ-induced filopodia production in microglial cells.
(A) Representative bright field photomicrographs of BV-2 cells were taken with an inverted Nikon microscope (20× objective). (B, C) BV-2 and HAPI cells were pretreated with SF-E (0–80 (µg/mL) for 1 h prior to exposure to IFNγ (10 ng/mL) for 4 h. Determination of cells containing filopodia at 4 h after exposure to IFNγ. Results are expressed as % of filopodia containing cells versus total cell numbers using the IFNγ-stimulated group as control, 100% (see Methods). Results are expressed as the mean ± SEM (n = 3–4) and significant differences from the respective IFNγ-stimulated group was determined by one-way ANOVA followed by Dunnett’s tests, *p<0.05; **p<0.01.

