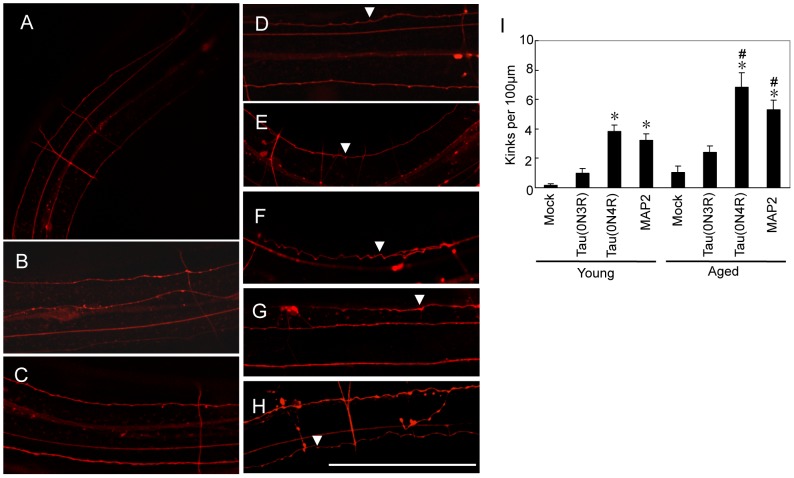
Figure 5. Age-dependent neuritic abnormalities in Tau- or MAP2-expressing worms.
(A–E) CLSM images of neurites in the posterior part of the worm are shown. (A) Mock/DsRed-transgenic (Tg) worm, young. (B) Mock/DsRed-Tg worm, aged. (C) Tau(0N3R)/DsRed-Tg worm, young. (D) Tau(0N3R)/DsRed-Tg worm, aged. (E) Tau(0N4R)/DsRed-Tg worm, young. (F) Tau(0N4R)/DsRed-Tg worm, aged. (G) MAP2/DsRed-Tg worm, young. (H) MAP2/DsRed-Tg worm, aged. The scale bar is 100 µm. (I) Numbers of abnormal kinks (arrows) per 100 µm neurite. “Young” indicates 4–5 days after hatching, and “aged” indicates 10–11 days. The data are expressed as the mean±SEM. Asterisks indicate significant differences versus mock in each age group (one-way ANOVA followed by Bonferroni–Dunn post hoc test). # indicates a significant difference in the young versus aged group in the same line (P<0.05, Student's t-test). n = 21 to 23.

