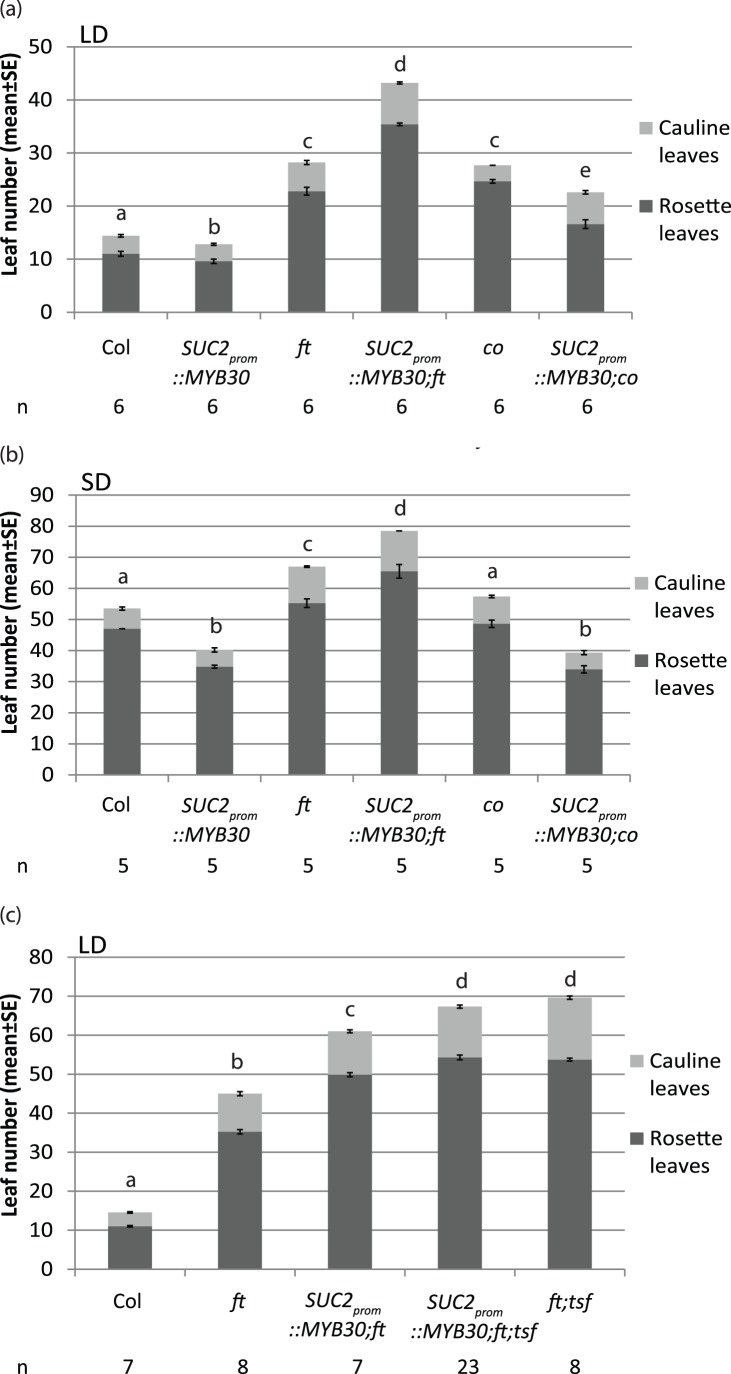
Figure 4. SUC2prom::MYB30 expression accelerates flowering dependent on FT and independent on CO.
Flowering time measurement of Col, SUC2prom::MYB30, ft, SUC2prom::MYB30;ft, co and SUC2prom::MYB30;co under LDs (a) and SDs (b) in the greenhouse. Plants SUC::MYB30;ft and SUC2prom::MYB30;ft;tsf were grown in LDs greenhouse (c). Statistical significance was determined using one way Analysis of Variance (ANOVA) followed by multiple comparison of Holm-Sidak method (p<0.01). Significant differences are indicated by different letters above the bars. The number of plants for each genotype (n) is indicated below the graph.

