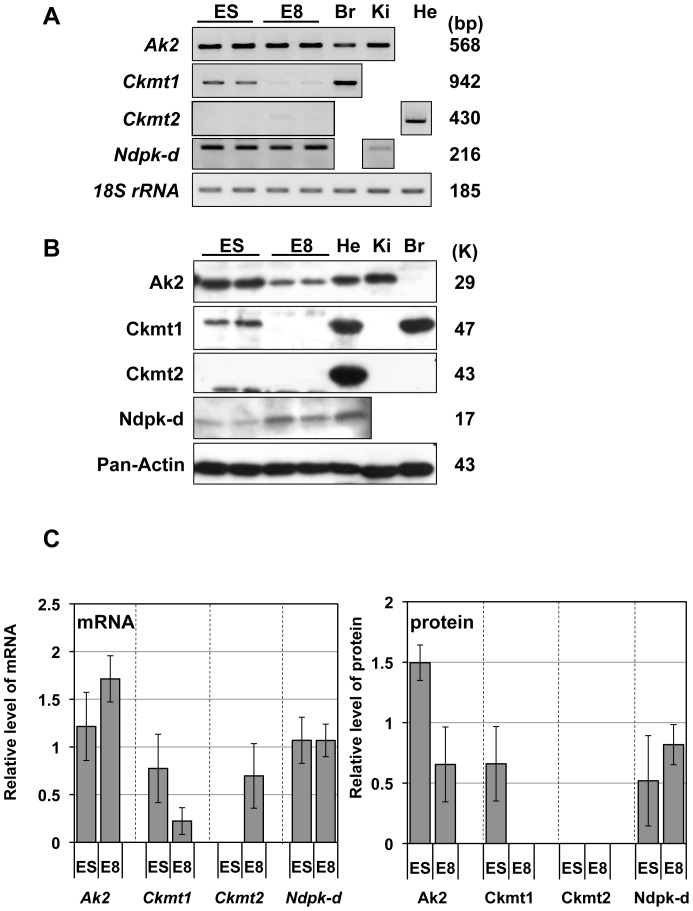
Figure 2. Expression of mitochondrial kinases in mouse ES cells and embryos.
(A) RT-PCR analyses were performed on mouse ES cells and E8 embryos. ES, mouse ES cells; E8, mouse E8 embryos. Br, brain; Ki, kidney; and He, heart tissues were used as PCR controls. 18S rRNA is presented as a loading control. Sizes of PCR products are presented on the right side of the panel. (B) Western blot analysis was performed on mouse ES cells and E8 embryos. Pan-Actin antibody is used as a control. Molecular weight is shown on the right side of the panel. (C) Relative mRNA and protein expression values of each enzyme in mouse ES cells and E8 embryos. ES mRNA and all protein data, N = 3; E8 mRNA, N = 5.

