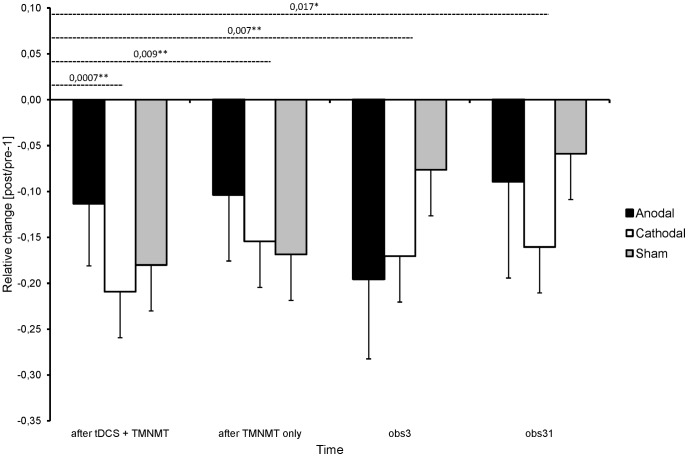
Figure 5. Changes in Tinnitus Handicap Questionnaire (THQ) values during and after treatment.
Changes in THQ total scores relative to the baseline scores as functions of time (after tDCS1 + TMNMT2 vs. after TMNMT only vs. obs3 vs. obs31) and tDCS condition (anodal group vs. cathodal group vs. sham group). Bars represent means, error bars denote standard errors of the mean. Negative values reflect improvement. Dashed black lines indicate significant post-hoc tests. *p<.05, **p<.01; 1Transcranial direct current stimulation; 2Tailor-made notched music training.

