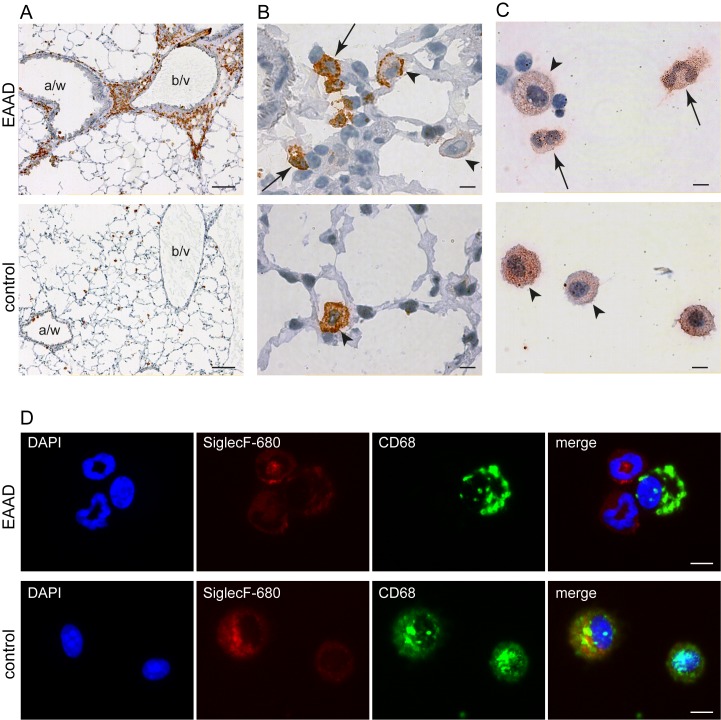
Figure 2. Expression pattern of Siglec-F.
Immunohistochemistry and immunofluorescence Siglec-F staining of lung sections and BAL cytospins of mice with EAAD (A - D, upper panels) and controls (A – D, lower panels). (A)– (B) represent sections of cryofrozen lungs stained with anti-Siglec-F antibody. (C) Representative images of cytospins from BAL stained with anti-Siglec-F antibody and (D) of cytospins from BAL fluid co-stained with anti-SiglecF-680 and anti-CD68. In EAAD lungs, Siglec-F is highly expressed in eosinophils surrounding the blood vessels (b/v) and airways (a/w) (A, upper panel), while control lungs are almost free of Siglec-F staining (A, lower panel), indicating the lack of immune cell infiltration. Higher magnification of EAAD lung sections demonstrates Siglec-F staining on eosinophils (arrows, bilobed nucleus) and macrophages (arrow heads) (B, upper panel). In cytospins, eosinophils (bilobed nucleus) from EAAD animals (C and D upper panel, arrows) demonstrate strong positive Siglec-F staining, whereas macrophages from both, EAAD and control animals (C, arrow heads and D, positive CD68 staining) show a variety of Siglec-F expression levels. Scale bars in A: 2.5 mm; in B–D: 5 µm.

