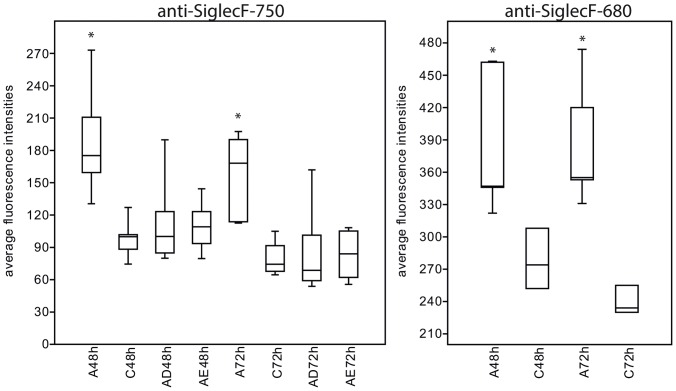
Figure 5. Quantification of in vivo imaging results.
Box plot of average fluorescence intensities over the lung area for all groups at 48-labeled anti-Siglec-F antibody injection. Lung intensities of EAAD mice are significantly higher (represented by asterisk *) compared with control mice and treated mice at 48 h and 72 h after antibody application; A = EAAD, C = control, AD = EAAD, dexamethasone treated, AE = EAAD, beta-escin treated.

