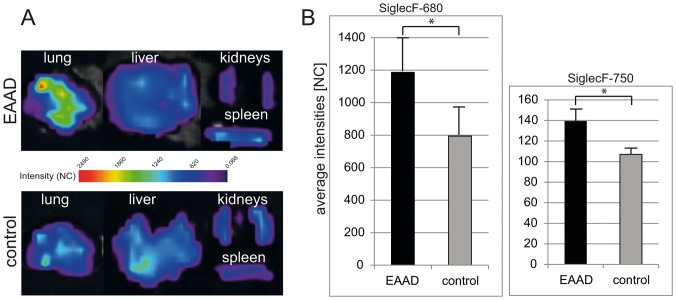
Figure 6. Ex vivo imaging results.
(A) Representative images of fluorescence intensities of explanted lungs, livers, kidneys and spleens of EAAD (upper panel) and control mice (lower panel). (B) Bar graph of average fluorescence intensities of explanted lungs from mice injected with anti-SiglecF-680 (left panel) or anti-SiglecF-750 (right panel). Ex vivo lung scans demonstrate a significant difference between signal intensities of EAAD lungs and healthy lungs (A and B), while liver, spleen and kidneys show low intensities in both EAAD and control mice (A). NC = normalized counts.

