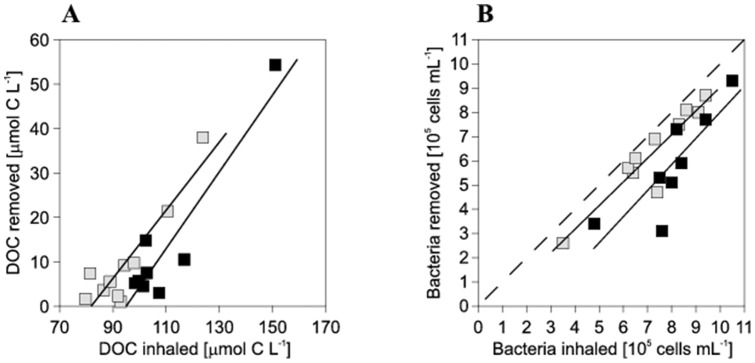
Figure 3. Removal of DOC (A) and bacterial cells (B) by Siphonodictyon sp. (black) and C. delitrix (grey) plotted against ambient (inhaled) concentrations.

Both species responded linearly to elevated DOC (R2 = 0.88; p = 0.004 and R2 = 0.84; p = 0.002) and bacterial concentrations (R2 = 0.72; p = 0.045 and R2 = 0.87; p = 0.001) within the full concentration range encountered. Dashed line represents 100% bacterial removal.
